
The Nasdaq 100 is an index that represents the performance of the 100 largest companies listed on the Nasdaq stock exchange. It includes companies from various sectors such as technology, telecommunications, retail, biotechnology, and more except financial companies. The index is often used as a benchmark for the performance of the technology sector and growth-oriented companies.
Some well-known companies included in the Nasdaq 100 index are Apple, Microsoft, Amazon, Alphabet (Google), Meta (Facebook), Intel, Cisco Systems, Tesla, and Netflix. Investors and traders often use the Nasdaq 100 as a benchmark to gauge the overall performance of the technology and growth sectors.
Currently, Nasdaq 100 index is trading around 14784.
The Nifty IT is an index that represents the performance of the Information Technology sector in the Indian stock market. It includes companies from various segments of the IT sector, such as software services, IT consulting, IT infrastructure, and IT-enabled services. The index is designed to reflect the overall performance of the IT industry in India and is widely used by investors, traders, and market participants to track and analyse the IT sector’s performance.
It consists of the top ten IT companies in India, some prominent companies in Nifty IT include Tata Consultancy Services (TCS), Infosys, Wipro, HCL Technologies, Tech Mahindra, Mphasis, Coforge, etc.
Currently, the Nifty IT index is trading around at the level of 28930.
Let’s compare the five-year return of both the Index.
|
Year |
Annual Return |
|
|
Nasdaq 100 |
Nifty IT |
|
|
2023 * |
35.00% |
1.15% |
|
2022 |
-32.97% |
-26.05% |
|
2021 |
26.63% |
59.59% |
|
2020 |
47.58% |
54.94% |
|
2019 |
37.96% |
8.39% |
The highest return Nasdaq 100 has generated is 101.95% in the year 1999 while the worst return the index has generated with a negative return of 41.89% in the year 2008 during the dot com bubble. Post that during last year in 2022, it has again generated a negative return of 32.97%.
The Nifty IT generated a multibagger return of 492% in the same year 1999 when the Nasdaq generated its highest return of 101.95% and generated a negative return of 54.56% in the year 2008 fell more than Nasdaq in the same year. During the last year 2022, it generated a negative return of 26.05% while Nasdaq fell by 32.97% here Indian IT index stood stronger during tuff times when both the Index was falling.
If we talk about the return of the current year Nifty IT index shows sluggishness with a nominal return of 1.15% whereas Nasdaq 100 has shown a magnificent return of 35% clearly surpassing the Indian Index.
Both the indexes consist of IT companies, Nasdaq is bigger in size and has 100 companies along with IT companies whereas Nifty IT Index is small in size and has only 10 IT companies in the list despite the fact it has generated an exceptional return during the year 1999, Nifty IT surpasses the return with a substantial difference, however, during 2019 Nasdaq surpasses the Nifty IT Index, in 2019 again Nasdaq returns were more than Nifty IT index and during talking about the current year, Nasdaq Index is again winning the race.
Another important difference is Nifty IT consists of only Indian companies while Nasdaq 100 companies consist of both US as well as other International companies.
The Nasdaq 100 has been known for its strong performance, especially in the technology sector. It has benefited from the success of major tech companies like Apple, Microsoft, Amazon, and Alphabet. Over the past five years, the Nasdaq 100 had experienced significant growth, driven by the overall growth in the technology sector. Both the Indexes rebalance their components on a timely basis.
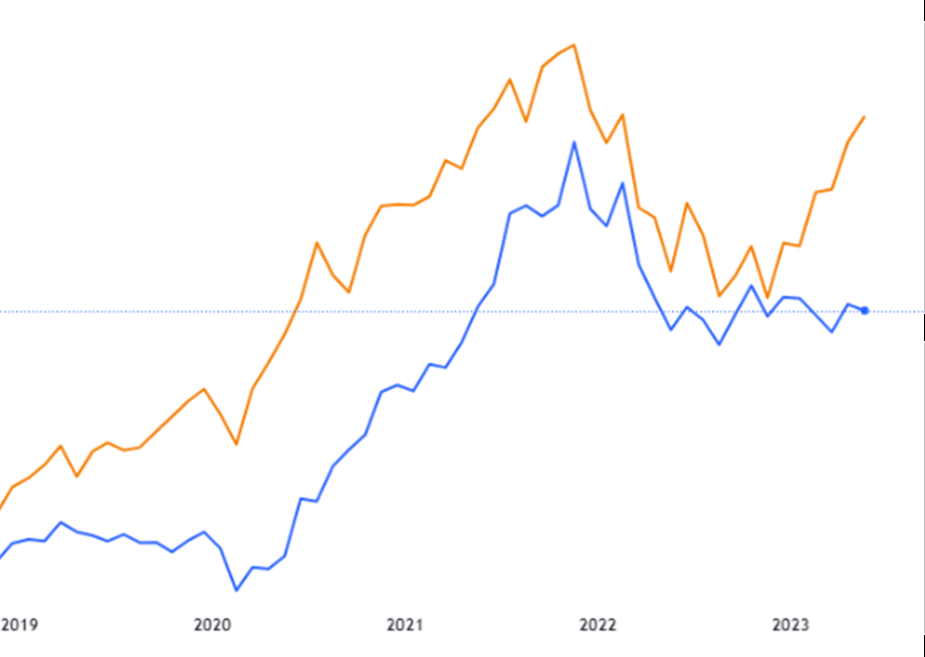
On charts, Nasdaq 100 is forming higher highs and showing strength while the Indian IT index is consolidating in a big range once it breaks the range it may give a good return and surpass the return of the Nasdaq 100.
Below is the chart presentation of both the Index. Blue colour belongs to Nifty IT and Orange is Nasdaq.
Published on: Jun 13, 2023, 3:08 PM IST
We're Live on WhatsApp! Join our channel for market insights & updates

Get the link to download the App

