Now here’s where we grabbed your attention.
You are seeing a change in Avg. price in our Superapp and must be wondering why this is happening. This happens for users who recently had a CA in their portfolio, for example, scrips like LnT and Mindtree. Plus, we have decided to go another step ahead and give you better accuracy and detail.
Summing up, here are the two reasons why you are seeing a change in your avg. price for certain stocks:
Before we delve deeper, let’s understand Corporate Actions in detail.
Events initiated by a company, approved mostly by their board of directors and may have a direct impact on the shareholders are called Corporate Actions (CA). For example, dividends, stock splits, mergers and acquisitions, etc. are a few key corporate actions
Changes made in Corporate Action Handling:
The changes are applicable in the case of Split and Merger:
Since in case of split and merger, we have an ISIN change, we need to close the old position and open the new position with the new ISIN, name, and new qty.
To have more accurate calculations we have started taking 8 decimal digits so that your average price is more accurate.
Here’s a transaction to help you understand better:
Let’s assume, Mr. Arpit bought 25 stocks of LTI over the period of time mentioned below.
| Buy Date | Scrip | Qty | Invest. amt | Avg Price |
| 1/10/2020 | LTI | 10 | 20000 | 2000 |
| 13/03/2021 | LTI | 10 | 30000 | 3000 |
| 17/07/2022 | LTI | 5 | 15000 | 3000 |
| Total | LTI | 25 | 65000 | 2600 |
On 23rd November, LTI declared a merger with Mindtree. Now, Let’s understand how Mr. Arpit’s portfolio for LTIM would look post 23rd November.
In our Old Solution, here’s how the data looked like:
| Buy Date | Scrip | Qty | Invest. Amt | Avg Price |
| 23/11/2022 | LTIM | 25 | 65000 | 2600 |
But if you observe, in our New Solution, we try to resolve this issue in a clearer way:
| Buy Date | Scrip | Qty | Invest. Amt | Avg Price |
| 1/10/2020 | LTIM | 10 | 20000 | 2000 |
| 13/03/2021 | LTIM | 10 | 30000 | 3000 |
| 17/07/2022 | LTIM | 5 | 15000 | 3000 |
| Total | LTIM | 25 | 65000 | 2600 |
Now, there’s no problem for Mr. Arpit to understand when he actually bought the shares. This further simplifies things for Mr. Arpit when he tries to sell the shares. How? Keep reading.
Let’s take the same example, Mr. Arpit sold 15 LTIM scrips on 12/12/2022.
Avg. price in the old calculation:
| Buy Date | Scrip | Remaining Qty. | Invest. amt | Avg Price |
| 23/11/2022 | LTIM | 10 | 26000 | 2600 |
But Avg. price as per the new calculation (FIFO):
| Buy Date | Scrip | Qty | Invest. amt | Avg Price |
| 13/03/2021 | LTIM | 5 | 15000 | 3000 |
| 17/07/2022 | LTIM | 5 | 15000 | 3000 |
| Total | LTIM | 10 | 30000 | 3000 |
Please observe that the AVG price has increased by 400. This detailed view gives Mr. Arpit the
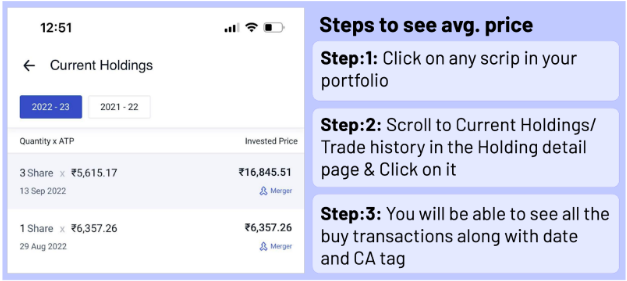
The trade history along with the Corporate Actions tag is available to you under the “Current Holdings” breakup.

In this case users will see transactions of 1/10/2020 with a merger tag.
We have always been believers of “Detailing”. Hence, while we make any update on our Superapp, we focus on you and issues you face. If you want to know more about our Portfolio, click here. And just in case you haven’t started your journey with us, come open a demat account with us and know more about how we keep striving ahead.
Published on: Mar 8, 2023, 12:43 PM IST
We're Live on WhatsApp! Join our channel for market insights & updates
