
Bajaj Holdings & Investment Ltd., a prominent non-banking financial company with strategic investments in key entities like Bajaj Auto Ltd. and Bajaj Finserv Ltd., is currently making waves in the stock market.
A detailed analysis of its stock performance since December 07, 2023, reveals a fascinating technical continuation pattern known as the Bullish Up Flag. This pattern, identified by a consolidation phase reinforced by the 30-day moving average (DMA) and a retracement of 38.2% from the previous rally that commenced on October 30, 2023, at Rs 6,627.90, hints at the potential for a significant price movement in the near term.
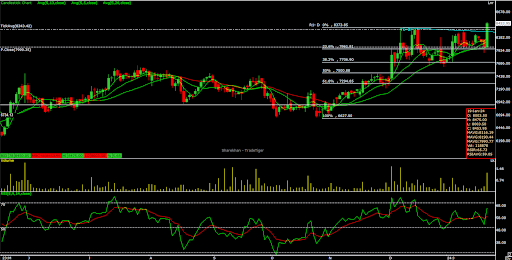
In today’s trading session, Bajaj Holdings stole the spotlight, surging impressively by over 5.5% with robust trading volumes exceeding 1 lac shares, confirming a breakout from the Bullish Up Flag pattern. The breakout is further substantiated by the crossover of short-term moving averages (5-13 and 5-26 DMA), instilling confidence in this upward momentum.
Recent data showcases that Bajaj Holdings & Investment has not only breached the latest swing high of Rs 8,370 but also achieved an intraday high of Rs 8,475, marking the high of the entire consolidation period. Closing above the trendline breakout level of Rs 8,280 solidifies this breakout, presenting an enticing opportunity for discerning swing investors. The projected target for this pattern is around Rs 10,350, indicating a substantial surge of more than 25% from the breakout point.
Enhancing this optimistic outlook is the 14-week Relative Strength Index (RSI), comfortably positioned within the bullish zone at around 65. This underscores the company’s favorable standing. With robust momentum indicators represented by the mentioned short-term key moving averages, both momentum traders and swing investors have compelling reasons to consider Bajaj Holdings & Investment Ltd. for strategic inclusion in their trading portfolios.
As the company rides the bullish momentum, investors keen on potential returns in the dynamic financial landscape find a promising opportunity in Bajaj Holdings & Investment Ltd.
Disclaimer: This blog has been written exclusively for educational purposes. The securities mentioned are only examples and not recommendations. It is based on several secondary sources on the internet and is subject to changes. Please consult an expert before making related decisions.
Published on: Jan 19, 2024, 3:53 PM IST
We're Live on WhatsApp! Join our channel for market insights & updates

Get the link to download the App

