
The Nifty Bank index has extended its fall for the third straight day in early deals on Thursday, marking a fresh one-month low. The index is down by a little over 5% from its high of 53,357.70, which was registered on July 04, 2024.
The Nifty Bank index has been forming a sequence of lower highs and lower lows. The index is trading below its 20-day moving average (20-DMA), and the slope of the 20-DMA is trending downwards. This trend indicates a bearish sentiment in the market.
Interestingly, with a correction of 5% from the highs registered on July 04, 2024, the Nifty Bank index has reached a crucial juncture. The index is hovering around the 38.2% retracement level of the rally seen from the lows of June 04, 2024, to the high of July 04, 2024. Additionally, the 50-DMA, which is trending higher, is also placed around the same level. This indicates that the range of 50,650-50,680 is a crucial support zone, formed by the confluence of the rising 50-DMA and the 38.2% retracement level.
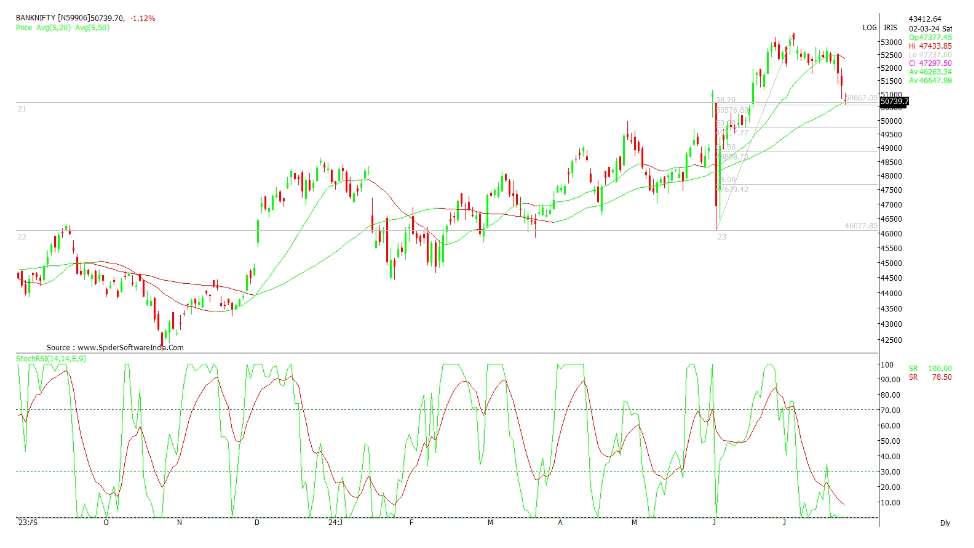
Furthermore, there is an observation that the index is undergoing a retracement from overbought levels after a 15% rally from the lows of June 04, 2024. Historically, since the beginning of CY2024, after each 15% rally, the Nifty Bank index has a tendency to correct anywhere between 8-10% from the highs. In the current context, the index has already corrected 5%, and the stochastic RSI is in an oversold region on the daily time frame.
Given these factors, a pullback could be seen, or perhaps a period of time consolidation may occur from this point onwards. The oversold condition of the stochastic RSI and the proximity to significant support levels suggest that the downside may be limited, and a rebound could be on the horizon.
Disclaimer: This blog has been written exclusively for educational purposes. The securities mentioned are only examples and not recommendations. It is based on several secondary sources on the internet and is subject to changes. Please consult an expert before making related decisions.
Published on: Jul 25, 2024, 12:42 PM IST
We're Live on WhatsApp! Join our channel for market insights & updates

Get the link to download the App

