
The Nifty Bank, an index comprising India’s top 12 banking stocks, experienced a significant rally on Wednesday, climbing over 1,000 points to reach a new record high. This surge was primarily driven by heavyweight private sector lender HDFC Bank. The index hit an intraday peak of 51,957, surpassing its previous record of 51,133 set on June 3, just before the General Election results were announced.
On June 4, the day the election results were declared, the Nifty Bank index plummeted by over 4,000 points, settling at the 47,000 level. However, by the end of Wednesday, the Nifty Bank managed to close at 51,398.05, up by 957.15 points or 1.9%. HDFC Bank played a major role in this rally, contributing to half of the movement. Other significant contributors included ICICI Bank, which rose by 2%, and Axis Bank, which climbed by 3%. In contrast, the benchmark indices Nifty and Sensex closed flat on Wednesday despite hitting all-time intraday highs.
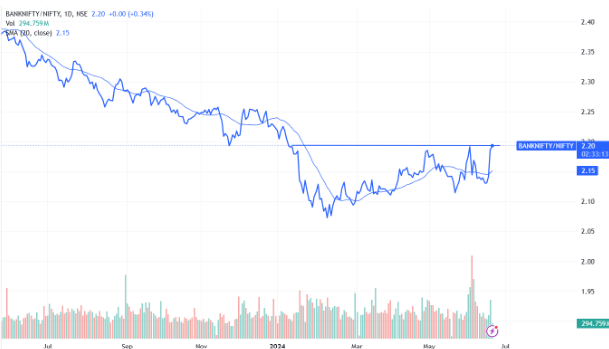
The momentum continued into Thursday, with the Nifty Bank adding another 0.46%, further outperforming the frontline Nifty50 index. This consistent performance highlights the importance of examining the ratio chart of Nifty Bank to Nifty.
A ratio chart in technical analysis is a valuable tool for comparing the relative performance of two sectors. By plotting the ratio of one sector’s price to another’s, traders and analysts can identify trends, relative strength, and potential market turning points. An upward-sloping ratio chart indicates that the numerator (Nifty Bank) is outperforming the denominator (Nifty).
The ratio chart of Nifty Bank to Nifty has reached a six-month high and is at a critical juncture, as it has historically turned lower from this level. Therefore, it is essential to be vigilant and watchful of any potential changes.
Indian banks are currently in a favorable position. They are well-capitalized and have the lowest net non-performing assets (NPAs) in over a decade. The quality of corporate credit has significantly improved over the past 5-7 years. The banking sector has also seen a resurgence in profits and profitability, with the return on equity (RoE) in FY24 being the highest since FY11.
Disclaimer: This blog has been written exclusively for educational purposes. The securities mentioned are only examples and not recommendations. It is based on several secondary sources on the internet and is subject to changes. Please consult an expert before making related decisions.
Published on: Jun 20, 2024, 1:40 PM IST
We're Live on WhatsApp! Join our channel for market insights & updates

Get the link to download the App

