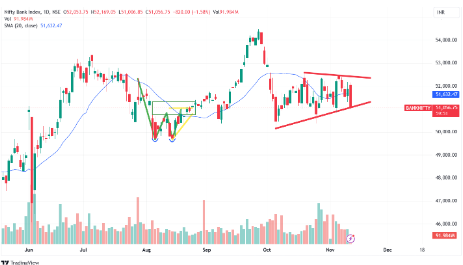
The Bank Nifty index recently experienced its steepest decline in over a month, down by 1.58% lower at 51,056.75. The daily chart shows significant technical patterns, providing insights into possible future price action.
The Bank Nifty chart illustrates a triangular pattern, which often suggests a potential downside continuation if the support level is breached. The index is currently testing the lower trendline of this triangle, indicating a critical support zone around 51,000.

The 20-day simple moving average (SMA), currently at 51,632.47, sits above the price, acting as a resistance.
Key support lies around 51,000, while immediate resistance is near 52,000. A breakdown below 51,000 could trigger further declines, potentially testing lower support zones around 50,000.
The Bank Nifty is at a critical juncture. Traders should monitor the 51,000 support closely, as a breakdown could confirm bearish momentum. Conversely, a bounce above 52,500 would signal renewed strength.
Disclaimer: This blog has been written exclusively for educational purposes. The securities mentioned are only examples and not recommendations. It is based on several secondary sources on the internet and is subject to changes. Please consult an expert before making related decisions.
Published on: Nov 12, 2024, 6:13 PM IST
We're Live on WhatsApp! Join our channel for market insights & updates
