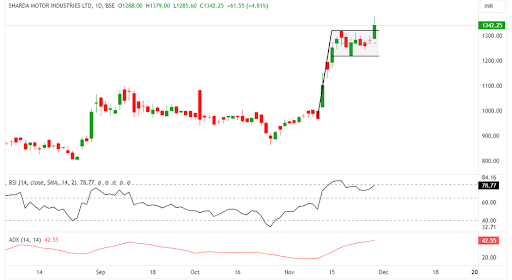
Sharda Motor Industries is currently trading at Rs 1345 with a chart pattern breakout sustaining the momentum. The stock price has formed a flag chart pattern, which is a trend continuation pattern.
A flag chart pattern is a technical analysis pattern that indicates a continuation of the prevailing trend. It is characterized by a sharp countertrend move (the flag) that follows a strong directional move (the flagpole). The flag is typically a rectangular or triangular consolidation pattern that forms within the confines of two parallel trendlines.
Flag patterns are considered to be continuation patterns because they suggest that the prevailing trend will resume after the consolidation period is complete. The breakout from the flag is typically followed by a move in the same direction as the flagpole.
Bullish flag: This pattern occurs after an uptrend. The flagpole is a strong upward move, and the flag is a consolidation period that takes place within a trading range. The breakout from the flag is typically followed by a continuation of the uptrend.
Flag patterns can be used to identify trading opportunities. For example, a trader might buy a stock that breaks out of a bullish flag pattern, or sell a stock that breaks out of a bearish flag pattern.

In the above technical chart of Sharda Motor Industries, the stock price has formed a bullish flag chart pattern. It is a bullish flag chart pattern, as the prior trend was bullish and the price was in an uptrend and formed a pole, and then the stock traded in the range of Rs 1220 and Rs 1322 for eight days. On November 29, 2023, the price was given a breakout of the flag chart pattern. Looking at the other supportive parameters, the RSI is trading at a level of 78, which is in the bullish zone but not overbought yet. The RSI suggests high strength as it is again moving upwards to the overbought zone. The volume trading since the breakout is on the higher side than the daily average. The average directional index stands at 42, which depicts very high directional strength for the stock price. The potential reach levels might fall to Rs 1600 as the height of the pole is 300 points.
Sharda Motor Industries Ltd is engaged in the manufacture and trade of automobile components. The firm specializes in motor vehicle parts such as suspension, silencers, exhaust pipes, car seat frames and seat covers, and others.
Disclaimer: This blog has been written exclusively for educational purposes. The securities mentioned are only examples and not recommendations. It is based on several secondary sources on the internet and is subject to changes. Please consult an expert before making related decisions.
Published on: Nov 29, 2023, 6:22 PM IST
We're Live on WhatsApp! Join our channel for market insights & updates
