
Kirloskar Oil Engines is currently trading at Rs 599 with a chart pattern breakout sustaining the momentum. The stock price has formed a symmetrical triangle chart pattern, which is a trend continuation pattern.
A symmetrical triangle is a chart pattern that is formed when the price of an asset oscillates between two converging trendlines, one connecting a series of lower highs and the other connecting a series of higher lows. This creates a triangle shape that narrows as it progresses, indicating that the price is consolidating and indecisive about its future direction.
Symmetrical triangles are considered to be continuation patterns, meaning that they are more likely to resolve in the direction of the trend that preceded them. However, they can also break out in the opposite direction, so it is important to use other indicators to confirm the breakout.
Traders can use symmetrical triangles to identify potential trading opportunities. For example, a trader might buy an asset if it breaks out above the upper trendline of a symmetrical triangle that formed during an uptrend. Conversely, a trader might sell an asset if it breaks out below the lower trendline of a symmetrical triangle that formed during a downtrend.
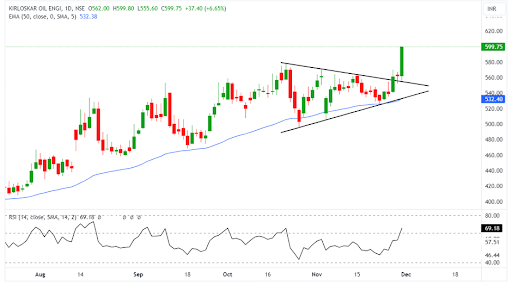
Kirloskar Oil Engines has given a symmetrical triangle chart pattern breakout with heavy buying as the day candle closed near its day high. The stock price broke the upper trendline of the triangle on Tuesday, showed sustenance, and then rallied today. It is a strong breakout. The Relative Strength Index suggests bullish momentum as it is trading above the level of 65, breaking the previous high.
The stock has bounced from its 50-day EMA three times, showing the perfect technical setup for an uptrend. The price is at its all-time high and poised for growth and can fetch multibagger returns in cases of super bullish momentum. If the average directional index turns above level 20, the stock price may skyrocket to new highs. Kirloskar Oil Engines has generated remarkable gains for its shareholders, accumulating 78.55% in one year.
Kirloskar Oil Engines Ltd is engaged in the manufacture of internal combustion engines, gensets, electric pumps, and parts. It operates through the following segments: Engine, Electric Pumps, Financial Services, and Others.
Disclaimer: This blog has been written exclusively for educational purposes. The securities mentioned are only examples and not recommendations. The information is based on various secondary sources on the internet and is subject to change. Please consult with a financial expert before making investment decisions.
Published on: Nov 30, 2023, 5:25 PM IST
We're Live on WhatsApp! Join our channel for market insights & updates

Get the link to download the App

