
With price volume support, Century Enka and NCC have strong bullish breakout potential. The stock price has displayed an inverted head & shoulder and flag & pole chart pattern breakout, and is presently trading at Rs 486 and Rs 192. The breakout corresponds to the RSI, ADX, and other technical analysis indicators.
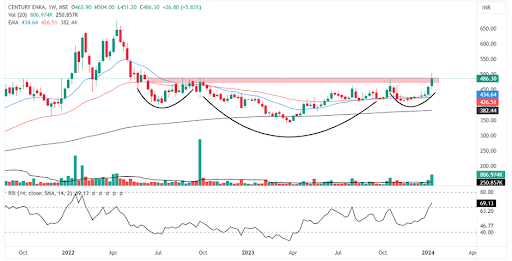
Weekly chart of Century Enka Ltd
Century Enka Ltd is currently exhibiting a robust bullish momentum on the weekly chart, marked by a compelling inverted head & shoulder breakout. This pattern is poised to be confirmed by the week’s close, supported by a strong bullish candle. Buyers are actively participating in the stock, evident from today’s substantial daily volume, providing ample strength for breakout sustainability.
The Wednesday trading session opened at Rs 475, experienced a day low of Rs 470, and surged to a day high of Rs 504. After six months of consolidation, the stock has convincingly breached the neckline of the pattern, signalling a potential trend reversal.
The stock’s current price surpasses previous highs, propelled by an increase in volume during the breakout. This breakout positions Century Enka for a positive trend shift, with accumulated volume suggesting further growth soon. The bounce from the 50-day and 20-day moving averages underscores the stock’s effort to establish new highs. The relative strength index entering the 65-80 range and a robust ADX at 33 on the daily chart indicates a high directional strength favouring a continued uptrend.
In case of a retracement, key support levels to monitor include the 20-day EMA and 50-day EMA. The minor upper resistance at Rs 520 complements the overall favourable structure, as the stock consistently trades above crucial moving averages, indicating a sustained long-term upward trend.
Century Enka Ltd engages in the manufacturing and sale of synthetic yarn-related products.
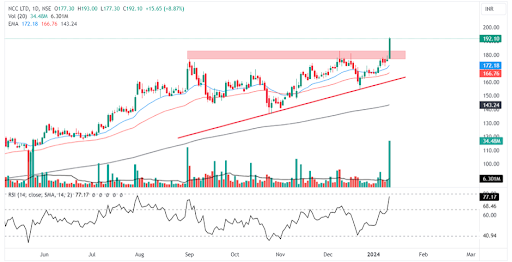
Dailly chart of NCC Ltd
NCC Ltd’s stock is currently characterized by a strong green daily candle, confirming a breakout from the ascending triangle chart pattern accompanied by a notable volume spike. Opening at Rs 177 on Wednesday, the stock reached an intraday high of Rs 193. This breakout follows four months of consolidation, suggesting a resumption of the bullish trend.
The confirmation of the breakout, marked by a strong upthrust in the daily candle, indicates a continuation of the bullish momentum. Trading at its all-time high, the stock may experience a rapid ascent following today’s sustained levels. The breakout is further supported by a price volume surge exceeding ordinary trading day volume.
The relative strength index within the 65-80 range hints at a potential sharp rise in the stock price, especially as it approaches the 80 level. The ADX, rising at 19, signifies nominal directional strength to sustain the uptrend. The 50-day EMA serves as a fundamental support level during corrective movements, with the overall structure favouring traders as the stock consistently trades above major moving averages.
NCC Ltd engages in the provision of construction and engineering services.
Disclaimer: This blog has been written exclusively for educational purposes. The securities mentioned are only examples and not recommendations. The information is based on various secondary sources on the internet and is subject to change. Please consult with a financial expert before making investment decisions.
Published on: Jan 10, 2024, 3:58 PM IST
We're Live on WhatsApp! Join our channel for market insights & updates

Get the link to download the App

