
Bharat Petroleum Corp and Linde India are identified as upside potential stocks based on technical analysis. Both stocks have displayed promising technical setup, including price volume action before and a potential to bounce back and breakout. Currently trading at Rs 630.20 and Rs 6,326.45 respectively, their price structures align with positive signals from technical indicators like RSI and ADX, breakout scenario in coming time.
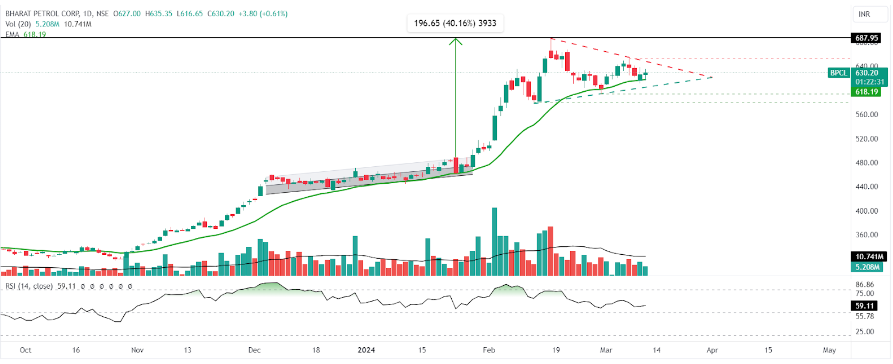
Daily chart of Bharat Petroleum Corp Ltd
On the daily chart, Bharat Petroleum Corp is presently showing consolidation close near to its 20-day EMA; the stock price is moving with a doji candle. The stock price may resume its strong momentum-up advance in the upcoming trading sessions if it is able to cross and close above its prior high level with the support of decent volume compared to current volume. Volume may start to pick up soon
Those who are considering a possible trade in Bharat Petroleum Corp might purchase the stock at the present price with a stop loss of Rs 580 and aim to buy above the firm’s all-time high.
The stock price is currently trading above all significant moving averages (EMAs), suggesting that it is likely about to turn short-term bullish once more. The stock price’s last uptrend saw a breakout from squeezed channel to a high of Rs 687 and generated gains for traders of 40.16% in only one month. The stock appears to be quite bullish when one looks at the Relative Strength Index, which is now trading at 57.12. The higher-than-average ADX of 32 indicates the present state of price momentum, which is probably going to build up momentum once the 52-week high level is broken.
In the event of a retracement, it is essential to monitor key support levels, particularly at Rs 580. The minor upper resistance is 52-week high, and if the stock starts back-to-back closes above 52-week high, then the stock may consistently trade above current levels.
Bharat Petroleum Corp. Ltd. is a holding company, which engages in the business of refining of crude oil and marketing of petroleum products.
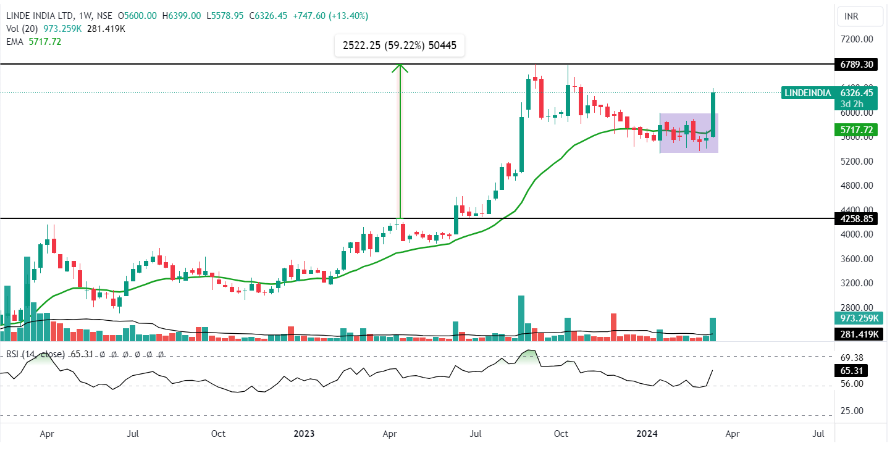
Weekly chart Linde India Ltd
With strong volume supporting the stock, Linde India’s current performance is typified by a favorable technical setup. The company is now trading at Rs 6,326.45 and rising again to initiate a fresh uptrend. The stock price is currently trading slightly above the 20-day EMA. Large amounts are trading on this week. The quantities are starting out slowly but are gradually increasing.
Those interested in a possible trade in Linde India could purchase the stock at the present price, setting a stop loss at prior higher low of Rs 5,330, and aim for a target price that is higher than the firm’s 52-week high.
The stock is trading above its 20-day and 50-day highs, and it is expected to find support at these levels going forward, given that it has bounced from them in the past. The prior stock price broke out of its 52-week high level and gained 59.22% of its value. Relative Strength Index is now up from the bottom end, trading at 65.31. This implies that there may be a big increase in the stock price. The ADX, which is now around 20, shows lower momentum and directional strength.
The level at Rs 4,258 serves as a crucial indicator for corrective movements and the overall market structure favours traders if the stock crosses and trades above 52-week high.
Linde India Ltd. engages in the manufacture and distribution of industrial gases.
Disclaimer: This blog has been written exclusively for educational purposes. The securities mentioned are only examples and not recommendations. The information is based on various secondary sources on the internet and is subject to change. Please consult with a financial expert before making investment decisions.
Published on: Mar 12, 2024, 4:26 PM IST
We're Live on WhatsApp! Join our channel for market insights & updates

Get the link to download the App

