With price volume support, Fiem Industries and Raymond have strong bullish breakout potential. The stock prices have displayed an ascending triangle and a consolidation breakout and are presently trading at Rs 2,515 and Rs 1,834. The breakout corresponds to the RSI, ADX, and other technical analysis indicators.
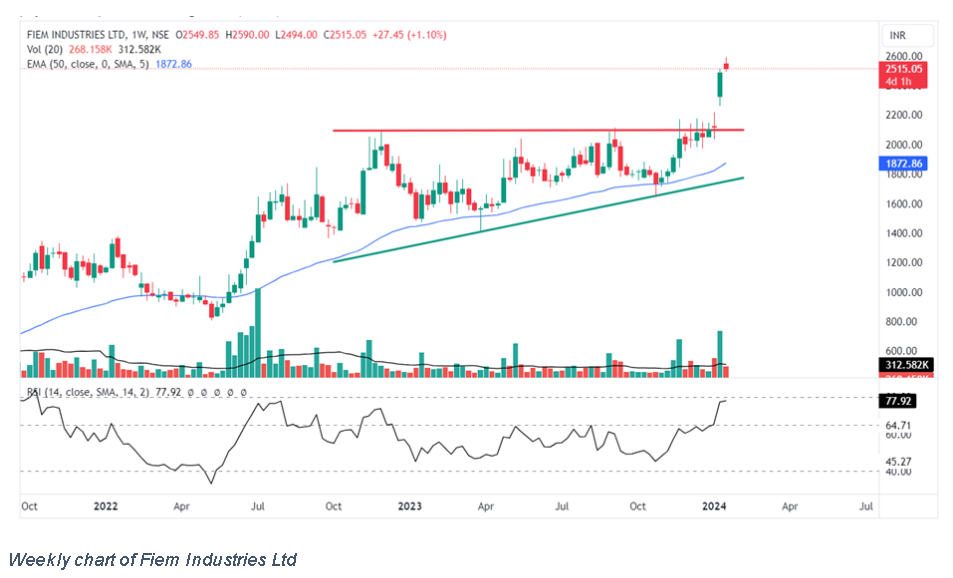
Fiem Industries is currently exhibiting a robust bullish momentum on the weekly chart, marked by a compelling consolidation breakout. This pattern is confirmed by the last week’s close, supported by a strong bullish candle. Buyers are actively participating in the stock, evident from today’s substantial daily volume, providing ample strength for breakout sustainability.
The Monday trading session opened at Rs 2,549, and surged to a day high of Rs 2,590. After 12 months of consolidation, the stock has convincingly breached the upper resistance of the pattern, signalling a potential trend continuation.
The stock’s current price surpasses previous highs, propelled by an increase in volume during the breakout. This breakout positions Fiem Industries for a positive trend shift, with accumulated volume suggesting further growth in the near future. The bounce from the lower 50-day EMA underscores the stock’s effort to establish new highs. The relative strength index entering the 65-80 range and a robust ADX at 43 on the daily chart indicates a very high directional strength favouring a continued uptrend.
In case of a retracement, key support levels to monitor include the level of Rs 2,100. The minor upper resistance is uncertain, and the overall favourable structure, as the stock consistently trades above crucial moving averages, indicating a sustained long-term upward trend.
Fiem Industries Ltd is a holding company, which engages in the manufacture and supply of automotive components.

Raymond stock is currently characterized by a strong green daily candle, confirming a breakout from the consolidation accompanied by a notable volume spike. Opening at Rs 1,744 on Monday, the stock reached an intraday high of Rs 1,845. This breakout follows a 1-month consolidation, suggesting a resumption of the bullish trend.
The confirmation of the breakout, marked by a strong upthrust in the daily candle, indicates a continuation of the bullish momentum. Trading above its prior high, the stock may experience a rapid ascent following today’s sustained levels. The breakout is further supported by a price volume surge exceeding ordinary trading day volume.
The relative strength index just entered within the 65-80 range hints at a potential sharp rise in the stock price, especially as it trades in the same range. The ADX, rising at 11, signifies low directional strength but it is showing recovery signs. The 50-day EMA serves as a fundamental support level during corrective movements, with the overall structure favouring traders as the stock consistently trades above major moving averages.
Raymond Ltd. is a textile and branded clothing company, which engages in the provision of end-to-end solutions for fabrics and garments.
Disclaimer: This blog has been written exclusively for educational purposes. The securities mentioned are only examples and not recommendations. The information is based on various secondary sources on the internet and is subject to change. Please consult with a financial expert before making investment decisions.
Published on: Jan 15, 2024, 5:11 PM IST
We're Live on WhatsApp! Join our channel for market insights & updates

Get the link to download the App

