
Krishna Institute of Medical Sciences and Jindal Poly Investment & Finance are identified as potential bullish stocks based on technical analysis. Both stocks have displayed promising technical patterns, including price volume support and a bounce back from support levels. Currently trading at Rs 2,249.05 and Rs 800 respectively, their price structures align with positive signals from technical indicators like RSI and ADX, suggesting continued upward momentum.
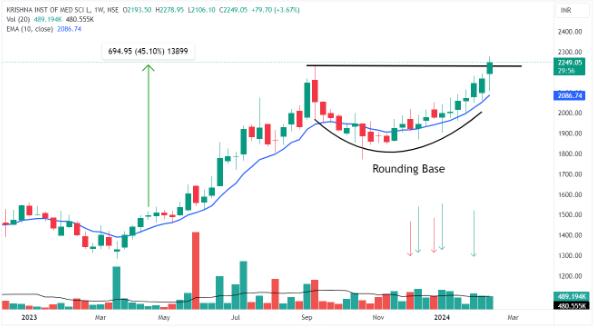
Weekly chart of Krishna Institute of Medical Sciences Ltd
Krishna Institute of Medical Sciences stock is currently displaying strong bullish momentum on the weekly chart, the stock price has broken its all-time high with a strong rounding base. If the stock manages to close above the 52-week high by support of the good volume, the stock price may start a strong momentum move for several trading sessions. Yesterday’s volume highlighted active buyer participation with Average daily volume today.
Friday’s trading session began at Rs 2,229 and reached a peak of Rs 2,279. After opening the stock has successfully surged to the all-time high on the chart, indicating a potential continuation sign of the long-term uptrend.
The current stock price is facing some selling pressure, driven by increased volume during a particular trading session, indicating that investors are interested in up moves. In the coming time, the stock price may show momentum with strong long candles, it may set the stock up for a stronger positive trend shift, and the accumulated volume suggests further growth shortly. The bounce from the trendline, emphasises the stock’s effort to establish new highs.
On the RSI chart, the relative strength index is trading in the bullish zone with gaining strength, and ADX trading at 28 indicates good directional strength, favouring normal movements on either side. In the event of a retracement, it is essential to monitor key support levels, particularly at a 10-week EMA. The minor upper resistance is uncertain, and if the stock closes above the 52-week high again in the next week, then the stock may consistently trade above current levels, affirming a sustained long-term upward trend.
Krishna Institute of Medical Sciences Ltd. engages in the provision of medical and healthcare services.
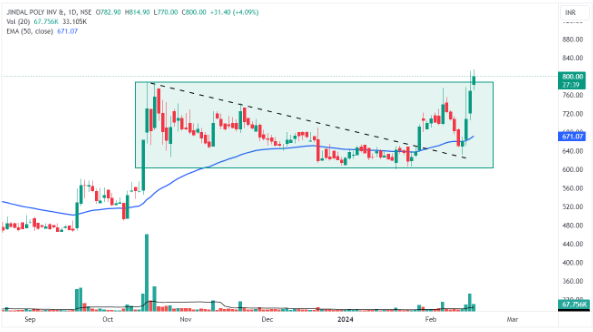
Daily chart of Jindal Poly Investment & Finance Co. Ltd
Jindal Poly Investment & Finance Co.Ltd stock performance is currently characterised by a promising technical setup, trading at Rs 800 and has the potential to continue its strong uptrend, accompanied by a significant increase in trading volume today. Currently, the stock price is on the verge of the breakout of the rectangle chart pattern by bouncing from the 50-day EMA.
Starting at Rs 782 on Friday, the stock reached an intraday high of Rs 814. The current upsurge of 3 days was notable as the volume also picked up
The bounce back has occurred with 4 days back hammer candle touching the 50-day EMA and the prior breakout level, indicating buying activity at the same level. After reaching its low, the stock witnessed a bounce back in the day trading sessions, following sustained levels near Rs 800. The current market action is supported by a surge in volume on up days and dry volume on down days for the stock.
The relative strength index (RSI) recently traded in a bullish range at 69.42 suggesting the potential for a significant upward movement in the stock price is still there, particularly as it continues to trade above this level. The ADX, currently at 26, indicates strong directional strength. The level at the 52-day EMA serves as a crucial indicator for corrective movements afterwards, and the overall market structure favours traders if the stock consistently trades above major moving averages.
Jindal Poly Investment & Finance Co Ltd operates as a holding company.
Disclaimer: This blog has been written exclusively for educational purposes. The securities mentioned are only examples and not recommendations. The information is based on various secondary sources on the internet and is subject to change. Please consult with a financial expert before making investment decisions.
Published on: Feb 16, 2024, 5:46 PM IST
We're Live on WhatsApp! Join our channel for market insights & updates

Get the link to download the App

