
With price volume support, General Insurance Corporation of India and Usha Martin have strong bullish breakout potential. The stock prices have displayed consolidation and symmetrical triangles, and both presently trading at Rs 343. The breakout aligns with positive signals from technical indicators such as RSI, ADX, and other key metrics, reinforcing the likelihood of continued upward momentum.
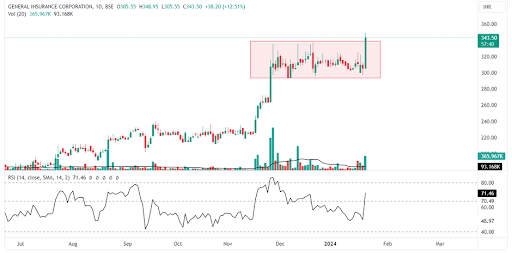
Daily chart of General Insurance Corporation of India
General Insurance Corporation of India is currently displaying a sustained bullish momentum on the daily chart, characterized by a notable breakout from a compelling consolidation range. This breakout is supported by the strong volume observed in today’s trade highlighting active buyer participation with substantial daily volume.
Friday’s trading session initiated at Rs 305 and reached a peak of Rs 348. After one month of consolidation, the stock has successfully breached the upper resistance of the pattern, indicating a potential long-term trend continuation.
The current stock price is about to exceed its 5-year high, driven by increased volume during the pre-consolidation rally. This breakout sets General Insurance Corporation of India up for a positive trend shift, and the accumulated volume suggests further growth in the near future. The bounce from the near 50-day EMA emphasises the stock’s effort to establish new highs.
On the daily RSI chart, the relative strength index is entering the 65-80 range with similar pattern formation, and a robust ADX at 40 indicates strong directional strength, favouring a continued uptrend. In the event of a retracement, it is essential to monitor key support levels, particularly at a 50-day EMA. The minor upper resistance is observed at Rs 448 which is an all-time high level of the stock, and the overall favourable structure is maintained as the stock consistently trades above crucial moving averages, affirming a sustained long-term upward trend.
General Insurance Corporation of India engages in the provision of reinsurance services to direct general insurance companies.
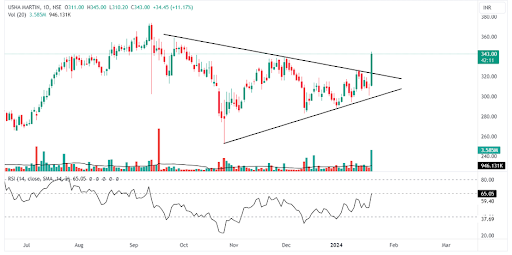
Daily chart of Usha Martin
Usha Martin’s current stock performance is characterized by a green daily candle facing, poised for a potential breakout from a symmetrical triangle, accompanied by a significant increase in trading volume. Starting at Rs 311 on Friday, the stock reached an intraday high of Rs 347. This breakout is notable as it follows a few months of consolidation, suggesting a likely start of the bullish trend.
Confirmation of the breakout occurred with a strong upthrust in the daily candle, indicating a sustained bullish momentum. After reaching its prior high, the stock may witness a rapid ascent in the next 2 trading sessions following today’s sustained levels. The current market action is supported by a surge in price volume, surpassing the typical trading day volume.
The relative strength index (RSI) recently entered the 65-80 range, suggesting the potential for a significant upward movement in the stock price, particularly as it continues to trade within this range. The ADX, currently at a low of 17, indicates very low directional strength. The 200-day Exponential Moving Average (EMA) serves as a crucial support level during larger corrective movements, and the overall market structure favours traders, with the stock consistently trading above major moving averages.
Usha Martin Ltd manufactures wire ropes and steel.
Disclaimer: This blog has been written exclusively for educational purposes. The securities mentioned are only examples and not recommendations. The information is based on various secondary sources on the internet and is subject to change. Please consult with a financial expert before making investment decisions.
Published on: Jan 19, 2024, 4:26 PM IST
We're Live on WhatsApp! Join our channel for market insights & updates

Get the link to download the App

