
Radico Khaitan and Mahindra & Mahindra are identified as upside potential stocks based on technical analysis. Both stocks have displayed promising technical setup, including price volume action and a potential to bounce back and breakout. Currently trading at Rs 1,626.70 and Rs 1,843 respectively, their price structures align with positive signals from technical indicators like RSI and ADX, breakout scenario likely to be in coming time.
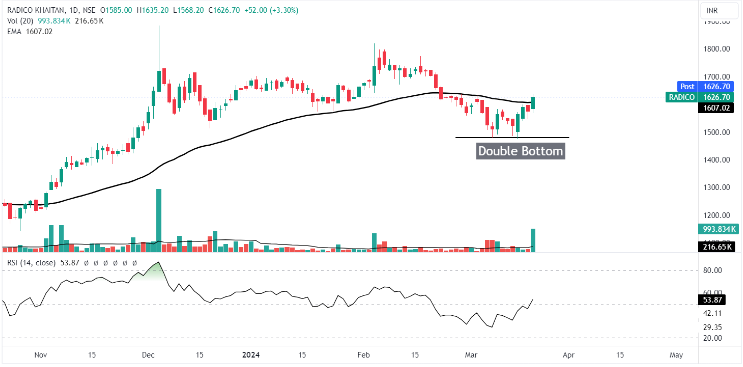
Daily chart of Radico Khaitan Ltd
On the daily chart, Radico Khaitan is presently showing rapid ascend from near support; the stock price is moving after forming double bottom. The stock price may resume its strong momentum-up advance in the upcoming trading sessions if it is able to cross and close above its 52-week high level with the support of decent volume compared to current volume. Volume saw a spike today.
Those who are considering a possible trade in Radico Khaitan might purchase the stock at the present price with a stop loss of Rs 1,540 on closing basis and aim to capitalize above its all-time high.
The stock price is currently trading above its support level, suggesting that it is likely about to turn short-term bullish once more. The stock appears to be quite neutral when one looks at the Relative Strength Index, which is now trading at 53.87. The ADX of 21 indicates the present state of price momentum, which is probably going with a good momentum.
In the event of a retracement, it is essential to monitor key support levels, particularly at Rs 1,600. The minor upper resistance is 52-week high, and if the stock starts back-to-back closes above 52-week high, then the stock may consistently trade above current levels.
Radico Khaitan Ltd. engages in the manufacture and trade of liquor and alcoholic beverages.
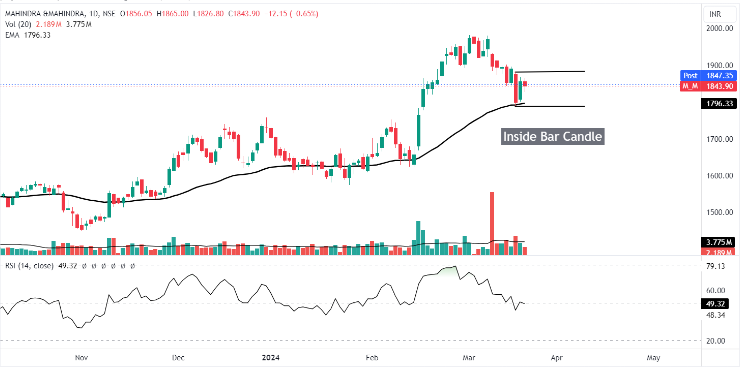
Daily chart of Mahindra & Mahindra Ltd
Mahindra & Mahindra’s current performance is typified by a favourable technical setup. The company is now trading at Rs 1,843.90 and may consolidate by formation of inside bar candle. The stock price is currently trading slightly above the 50-day EMA.
Those interested in a possible trade in Mahindra & Mahindra could purchase the stock at the present price, setting a stop loss below 50-day EMA at Rs 1,740, and aim for a target price that is higher than the firm’s 52-week high.
The stock is trading above its 50-day EMA, and it is expected to find support at these levels going forward. Relative Strength Index is now up from the bottom end, trading at 49.32. This implies that there may be a potential to increase in stock price strength. The ADX, which is now around 24, shows good momentum and directional strength.
The level at Rs 1,700 and Rs 1,600 serving as a crucial indicator for corrective movement and the overall market structure favours traders if the stock crosses and trades above 52-week high.
Mahindra & Mahindra Ltd. is a holding company, which engages in the manufacturing of automotive vehicles.
Disclaimer: This blog has been written exclusively for educational purposes. The securities mentioned are only examples and not recommendations. The information is based on various secondary sources on the internet and is subject to change. Please consult with a financial expert before making investment decisions.
Published on: Mar 19, 2024, 5:23 PM IST
We're Live on WhatsApp! Join our channel for market insights & updates

Get the link to download the App

