
Voltas and Vijaya Diagnostic Centre are positive breakout candidates with price volume support. The stock price is currently trading at Rs 930 and Rs 670, respectively has witnessed the formation of a rectangle and an ascending triangle chart pattern. The RSI, ADX and other parameters of technical analysis are in sync with the breakout.
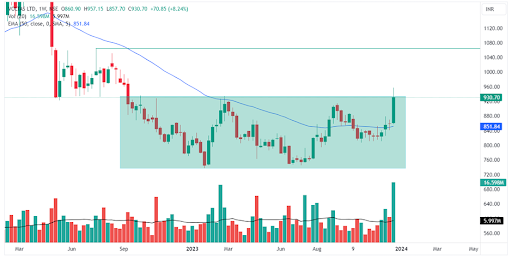
Weekly chart of Voltas Ltd
Voltas’ stock is trading with a strong bullish candle on a weekly chart, which is on the verge of a rectangle chart pattern breakout. Today, the daily volume spiked to its maximum in ten months.
On Wednesday, the stock witnessed a gap-up opening at Rs 908, jumped to its day high of Rs 957, and traded above the opening price only. It has been in consolidation for a long time, as it was in pattern creation.
Voltas has formed a rectangle chart pattern, and the price is about to breakout or reverse from here. With its breakout, it will start a new bullish trend. The stock price is trading at its 52-week high, and it may continue to trade higher in the coming time as the setup looks perfect. The stock price crossed its 50-day EMA, suggesting that the stock is trying to be in a bullish trade. The stock price also witnessed a price volume breakout on Wednesday, which is supporting this breakout to trade higher.
The relative strength index also entered the 80–100 range, suggesting the stock price may breakout and consolidate for a while. The ADX indicator line is trading near the 25 level but has not crossed the same level yet, which shows strong directional strength is still intact.
During any corrective moves, the major support level to watch for is between the 50-day EMA and Rs 935 in case of breakout. The overall structure remains favourable for traders, as the stock continues to trade above all its important moving averages, indicating a sustained upward trend.
The stock has given returns of 18.81% in 6 months.
Voltas Ltd engages in the provision of engineering solutions.
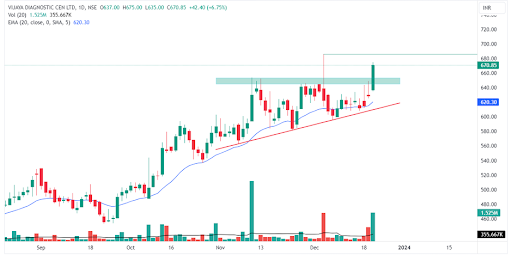
Daily chart of Vijaya Diagnostic Centre Ltd
Vijaya Diagnostic Centre’s stock is trading with a strong green candle and a breakout of an ascending triangle with a volume spike.
The stock witnessed a gap-up opening at Rs 637, touched its day low of Rs 635, and jumped its day high of Rs 675. The stock has been in range for 1 month before breakout.
Vijaya Diagnostic Centre has shown an ascending triangle breakout, continuing the bullish trend. The stock price is about to trade at its all-time high and may consolidate for a while to cool down this breakout as the day candle is solid green and dominating sellers. The stock price also witnessed a price volume breakout on Wednesday, making this breakout strong with a spurt in volume greater than average.
The relative strength index also entered the 65–80 range, suggesting the stock price may continue the strong uptrend ahead. The ADX indicator line is trading at a level of 30, which shows strong directional strength. The stock price is also respecting the moving average levels as it bounces from the 20-day EMA for each dip.
During any corrective moves, the major support level to watch for is Rs 645. The overall structure remains favourable for traders, as the stock continues to trade above all its important moving averages, indicating a sustained upward trend.
The stock has given impressive returns of 57.93% in a year.
Vijaya Diagnostic Centre Ltd provides diagnostic services, spanning pathological investigations, basic and high-end radiology, nuclear medicine, and related healthcare services.
Disclaimer: This blog has been written exclusively for educational purposes. The securities mentioned are only examples and not recommendations. The information is based on various secondary sources on the internet and is subject to change. Please consult with a financial expert before making investment decisions.
Published on: Dec 20, 2023, 4:28 PM IST
We're Live on WhatsApp! Join our channel for market insights & updates

Get the link to download the App

