
Harrisons Malayalam and J.B. Chemicals & Pharmaceuticals are the strong positive breakout candidates with price volume support. The stock price is currently trading at Rs 189 and Rs 1,585 respectively has witnessed the formation of the rectangle and symmetric triangle chart pattern. The RSI, ADX and other parameters of technical analysis are in sync with the breakout.
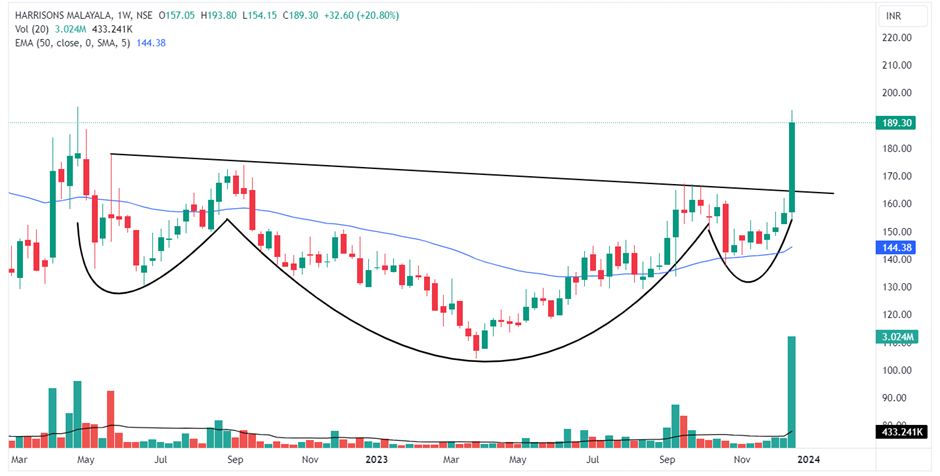
Weekly chart of Harrisons Malayalam Ltd
Harrisons Malayalam stock is trading with a strong bullish candle on a weekly chart, which has witnessed an inverted head and shoulder chart pattern breakout. Today, the daily volume spiked to its maximum in 2 years.
On Friday, the stock witnessed a gap-up opening at Rs 173 and jumped to its day high of Rs 193. The stock has been in consolidation for a long time, as it was in pattern creation.
Harrisons Malayalam has formed an inverted head and shoulder chart pattern, and the price has given a breakout of the same. With its breakout, it is about to start a new bullish trend. The stock price is trading at its 52-week high, and it may continue to trade higher in the coming time as the setup looks perfect. It bounced from its 50-day EMA, suggesting that the stock is trying to be in a bullish trade. The stock price also witnessed a price volume breakout on Friday, which is supporting this breakout to trade higher.
The relative strength index also entered the 65–80 range, suggesting the stock price may consolidate for a while. The ADX indicator line on the daily chart is trading above at 39 level, which shows super strong directional strength.
During any corrective moves, the major support level to watch for is Rs 165 in case of retracement. The overall structure remains favourable for traders, as the stock continues to trade above all its important moving averages, indicating a sustained upward trend.
The stock has given returns of 44.44% in 6 months.
Harrisons Malayalam Ltd is engaged in the plantations of tea and rubber estates.
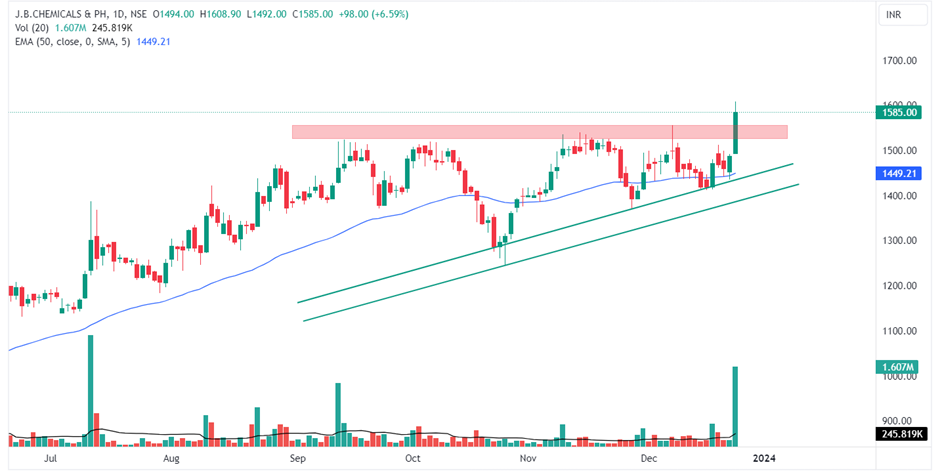
Daily chart of J.B. Chemicals & Pharmaceuticals Ltd
Shares of J.B. Chemicals & Pharmaceuticals are trading with a strong green candle and a breakout of an ascending triangle with a volume spike.
The stock witnessed a gap-up opening at Rs 1,494, touched its day low of Rs 1,492, and jumped its day high of Rs 1,608. It has formed a chart pattern from the last 3 months.
J.B. Chemicals & Pharmaceuticals has shown an ascending triangle breakout, continuing the bullish trend. The stock price is trading at its all-time high and may consolidate for a while to cool down this breakout as the day candle is solid green and facing a little selling pressure. The stock price also witnessed a price volume breakout on Friday, making this breakout strong with a spurt in volume more than 7 times.
The relative strength index also entered the 65–80 range, suggesting the stock price may continue the strong uptrend ahead. The ADX indicator line is turning from the level of 14 to rise again, which shows an early stage of emerging directional strength. The stock price is also respecting the moving average levels as it bounced from the 50-day EMA two days ago.
During any corrective moves, the major support level to watch for is Rs 1,527. The overall structure remains favourable for traders, as the stock continues to trade above all its important moving averages.
The stock has given returns of 60.67% in one year.
J.B. Chemicals & Pharmaceuticals Ltd is a holding company, which engages in the manufacture and trade of pharmaceutical products.
Disclaimer: This blog has been written exclusively for educational purposes. The securities mentioned are only examples and not recommendations. The information is based on various secondary sources on the internet and is subject to change. Please consult with a financial expert before making investment decisions.
Published on: Dec 22, 2023, 4:13 PM IST
We're Live on WhatsApp! Join our channel for market insights & updates

Get the link to download the App

