
Supriya Lifescience and Tega Industries are the strong positive breakout candidates with price volume support. The stock price is currently trading at Rs 315 and Rs 1,163 respectively has witnessed the formation of a cup & handle chart pattern. The RSI, ADX and other parameters of technical analysis are in sync with the breakout.
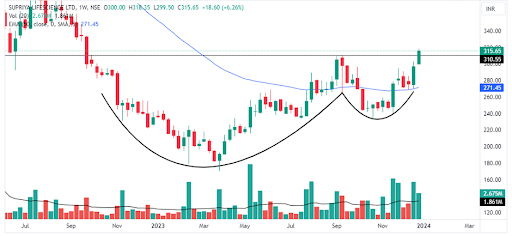
Weekly chart of Supriya Lifescience Ltd
Shares of Supriya Lifescience are trading with a strong bullish candle on a weekly chart, which has witnessed the cup & handle chart pattern breakout. Today, the daily volume spiked higher than the previous trading session as the buyers were excited to enter this stock.
On Tuesday, the stock witnessed a gap-up opening at Rs 300 and jumped to its day high of Rs 318. The stock has been in a downtrend before the formation of this pattern suggesting a trend reversal.
Supriya Lifescience has formed a cup & handle chart pattern, and the price has given a breakout of the same. With its breakout, it is about to start a new bullish trend. The stock price is trading at its 52-week high, and it may continue to trade higher in the coming time as the setup looks perfect. It bounced from its 50-day EMA, suggesting that the stock is trying to be in a bullish trade. The stock price also witnessed a price volume breakout on both Friday and Tuesday, which is supporting this breakout to trade higher.
The relative strength index also entered the 65–80 range, suggesting the stock price may consolidate for a while. The ADX indicator line on the daily chart is trading above at 25 level, which shows super strong directional strength.
During any corrective moves, the major support level to watch for is Rs 310 in case of retracement. The overall structure remains favourable for traders, as the stock continues to trade above all its important moving averages, indicating a sustained upward trend.
The stock has given returns of 29.06% in 6 months.
Supriya Lifescience Ltd. supplies active pharmaceutical ingredients (“APIs”), with a focus on research and development.
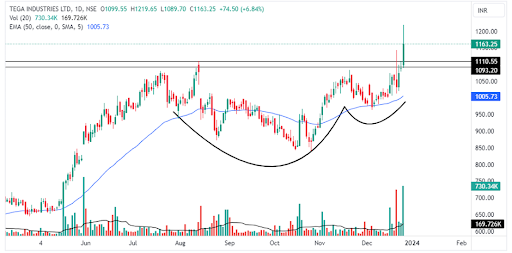
Daily chart of Tega Industries Ltd
Tega Industries’ stock is trading with a strong green candle and a breakout of a cup & handle chart pattern with a volume spike.
The stock witnessed a gap-up opening at Rs 1,099, touched its day low of Rs 1,089, and jumped its day high of Rs 1,219. The stock has been in the formation of a chart pattern for the last 5 months.
Tega Industries has shown a cup & handle breakout, continuing the bullish trend. The stock price is trading at its all-time high and may consolidate for a while to cool down this breakout as the day candle is solid green and facing selling pressure. The stock price also witnessed a price volume breakout on Monday, making this breakout strong with a spurt in volume more than the daily average.
The relative strength index also entered the 65–80 range, suggesting the stock price may continue the strong uptrend ahead. The ADX indicator line is rising and currently trading at 26, which shows an early stage of emerging directional strength. The stock price is also respecting the moving average levels as it bounced from the 50-day EMA a few days ago.
During any corrective moves, the major support level to watch for is Rs 1,190. The overall structure remains favourable for traders, as the stock continues to trade above all its important moving averages.
The stock has given returns of 100% in one year.
Tega Industries Ltd. manufactures and distributes critical to operating and recurring consumable products for the global mineral beneficiation, mining and bulk solids handling industry.
Disclaimer: This blog has been written exclusively for educational purposes. The securities mentioned are only examples and not recommendations. The information is based on various secondary sources on the internet and is subject to change. Please consult with a financial expert before making investment decisions.
Published on: Dec 26, 2023, 5:15 PM IST
We're Live on WhatsApp! Join our channel for market insights & updates

Get the link to download the App

