BEML and Mangalore Refinery & Petrochemicals are identified as upside potential stocks based on technical analysis. Both the scrips have displayed promising technical setups, including price volume action and a potential to breakout. Currently trading at Rs 3,207.45 and Rs 229.70 respectively, their price structures align with positive signals from technical indicators like RSI and ADX, breakout scenario in the upcoming trading sessions.

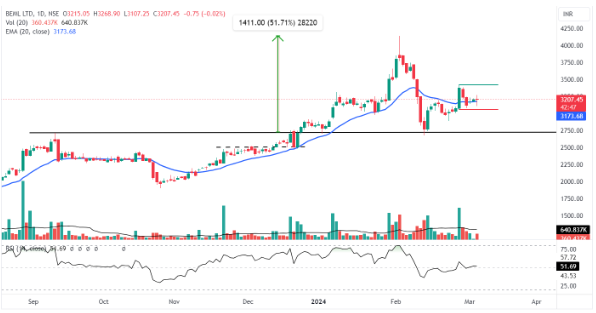
Daily chart of BEML Ltd
BEML Ltd is currently displaying narrow-range trading on the daily chart. The stock is trading with the indecision candle in the mid-level of the mother candle formed on February 27. If the stock manages to cross and close above the Rs 3,422 level with the support of good volume, it may start the strong momentum-up move in the coming trading sessions again. Currently, volume is dry, but traders are advised to look for a confirmed direction for trade.
Those who are looking for a potential trade in the BEML can buy the stock at the current level, maintaining a stop loss of Rs 3,003. Keep the target near or above the 52-week high.
At present, the stock is hovering around the 20-day EMA in search of trend direction. The previous uptrend of the stock price has logged 51.71% gains to the traders in a month, witnessing a breakout from the base structure to the high of Rs 3,855. Looking at the Relative Strength Index trading at 51.69, it suggests the neutral strength of the stock and the minimal buying point to gain maximum in the coming time as it reverted from the same level previously. ADX is at 17, which is on the lower side, reflecting the current scenario of a cooldown in price momentum that is likely to pick up soon with the breakout of the Rs 3,422 level.
In the event of a retracement, it is essential to monitor key support levels, particularly at Rs 2,722. The minor upper resistance is 52-week high, and if the stock starts back-to-back closes above 52-week high, then it may consistently trade above current levels.
BEML Ltd engages in the design, development, manufacture, and marketing of rail coaches, spare parts, and mining equipment.

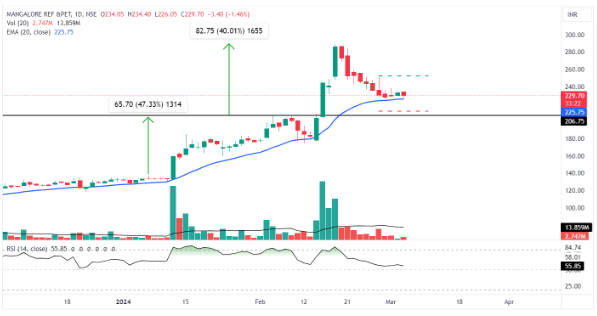
Daily chart Mangalore Refinery & Petrochemicals Ltd
Mangalore Refinery & Petrochemicals’ current stock performance is characterised by a promising technical setup, trading at Rs 229.70. It has the potential to break out at level Rs 252 to start a new uptrend with the help of positive volume. Currently, the stock price is in a lower ATR, trading just above the 20-day EMA. Previously, we saw large volumes traded on February 28. Currently, the volumes are dry, and no one is taking part in trading activity as the direction of the stock is not clear to the traders.
Those who are looking for a potential trade in the MRPL can buy the stock at the current level. Maintain a stop loss of Rs 211.80 and look for the target above the 52-week high of the stock.
The scrip is trading around the 20-day EMA, likely to take support at the same levels as it has shown in historical price data. The earlier stock price has given a breakout of the base pattern two times, gaining 47.33% and 40.01% of gains respectively. The Relative Strength Index recently traded at 55.85, declining from an overbought zone and likely to bounce back from the level of 50. This suggests the potential for a significant upward movement in the stock price. The ADX, currently at 34, indicates strong directional strength.
The level at Rs 206.75 serves as a crucial indicator for corrective movements and the overall market structure favours traders if the stock crosses the Rs 252 level.
Mangalore Refinery & Petrochemicals Ltd is an oil refining company, which engages in petroleum refinery services.
Disclaimer: This blog has been written exclusively for educational purposes. The securities mentioned are only examples and not recommendations. The information is based on various secondary sources on the internet and is subject to change. Please consult with a financial expert before making investment decisions.
Published on: Mar 4, 2024, 5:36 PM IST
We're Live on WhatsApp! Join our channel for market insights & updates
