
With price volume support, Genesys International and BEML have strong bullish breakout potential. The stock price has displayed a flag & pole chart pattern breakout and is presently trading at Rs 466 and Rs 3,043. The breakout corresponds to the RSI, ADX, and other technical analysis indicators.
Genesys International Corp Ltd
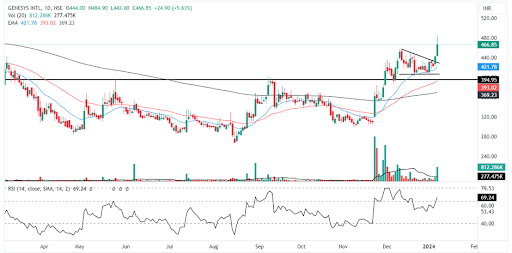
Daily chart of Genesys International Corp Ltd
Shares of Genesys International are currently trading with a strong bullish candle and a flag & pole breakout. Buyers are active in this stock as the setup is clean, and today’s daily volume is more than enough for this stock to sustain this breakout.
The stock opened at Rs 444 on Friday, traded at an intraday low of Rs 442, then surged to a day high of Rs 484. The stock has been in consolidation for the last 3 weeks and has broken over the upper trendline of flag, indicating a trend continuation.
The price of Genesys International is trading at its prior highs with impetus after a breakout with volume increase. With its breakout, it is poised to continue the positive trend. The tock volume accumulated from a few days back is more than enough to sustain the price momentum, and it is expected to grow further in the near future because the setup appears to be great. The stock price has bounced from its 20-day moving average, indicating that it is striving to set new highs. Today, the stock price had a flag & pole breakout, allowing the stock price to trade higher.
The relative strength index has now entered the 65-80 range, indicating that the stock price may rise further. The ADX is very strong at the level of 34, which indicates the directional strength is much higher to continue the uptrend.
In the case of a lower-side retracement, the major support level to watch for during any corrective swings is Rs 395. The stock price has the upper resistance at Rs 568 as target and a weak hurdle at Rs 480. The overall structure remains favourable for traders, as the stock continues to move above all of its important moving averages, indicating a long-term upward trend.
Genesys International Corp. Ltd is engaged in data processing activities including report writing.
BEML Ltd
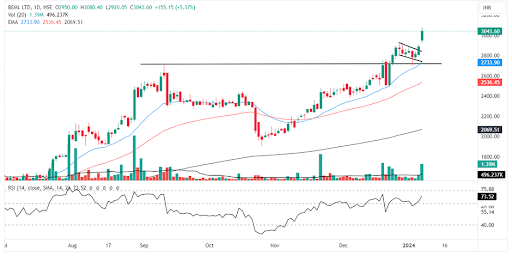
Dailly chart of BEML Ltd
BEML ‘s stock is trading with a green daily candle and has given a breakout of the flag & pole chart pattern with a volume spike today.
On Friday, the stock began at Rs 2,950, then made an intraday high of Rs 3,080. The stock has been in a consolidation for the last 6 days forming a flag.
BEML has confirmed the breakout after closure of the yesterday’s candle, which would continue the bullish trend. The stock is trading near its all-time high and may show a quick jump after today’s sustenance again. The stock price saw a price volume breakout today, which was accompanied by a volume rise bigger than the ordinary trading day volume.
The relative strength index has also into the 65-80 range, indicating that the stock price may begin to rise sharply in the near future as it crosses the level of 80. The ADX is very strong at the level of 31, which indicates the directional strength is much higher to continue the uptrend.
The 20-day EMA is the fundamental support level to watch for during any corrective movements. The overall structure remains favourable for traders, with the stock trading above all of its major moving averages.
BEML Ltd is involved in the design, development, manufacture, and marketing of rail coaches, spare parts, and mining equipment.
Disclaimer: This blog has been written exclusively for educational purposes. The securities mentioned are only examples and not recommendations. The information is based on various secondary sources on the internet and is subject to change. Please consult with a financial expert before making investment decisions.
Published on: Jan 5, 2024, 4:59 PM IST
We're Live on WhatsApp! Join our channel for market insights & updates

Get the link to download the App

