
With price volume support, GTPL Hathway and Vertoz Advertising are strong bullish breakout potential. The stock price has displayed an inverted head & shoulder and flag & pole chart pattern breakout and is presently trading at Rs 205 and Rs 578. The breakout corresponds to the RSI, ADX, and other technical analysis indicators.
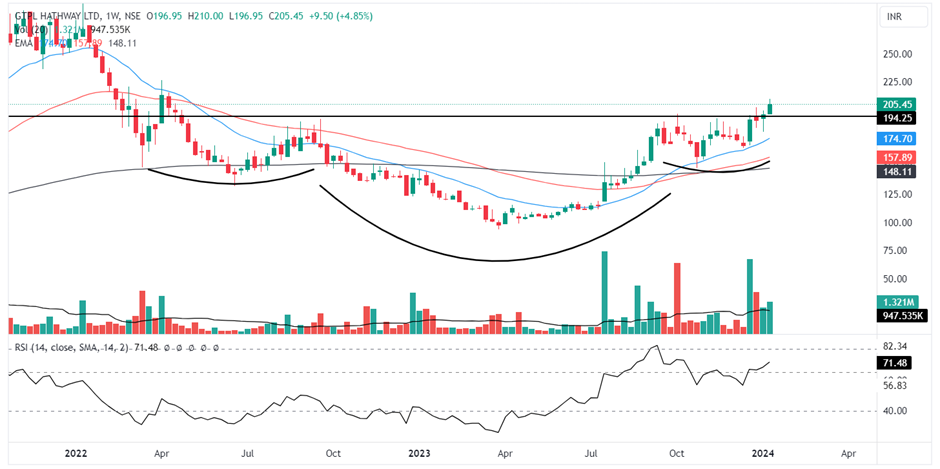
Weekly chart of GTPL Hathway Ltd
Shares of GTPL Hathway are currently trading with a strong weekly bullish candle and an inverted head & shoulder breakout. Buyers are active in this stock as the setup is clean, and today’s daily volume is more than enough for this stock to sustain this breakout.
The stock opened at Rs 196 on Monday, then surged to a day high of Rs 210. The stock has been in consolidation for the last 3 months and has broken over the neckline of the pattern, indicating a trend reversal.
The price of GTPL Hathway is trading above its prior highs with impetus after a breakout with volume increase. With its breakout, it is poised to start a new positive trend. The stock volume accumulated from a few days back is more than enough to sustain the price momentum, and it is expected to grow further shortly because the setup appears to be great. The stock price has bounced from its 50-day and 20-day moving average, indicating that it is striving to set new highs. Today, it showed sustenance of inverted head & shoulder breakout, allowing stock price to trade higher.
The relative strength index has now entered the 65-80 range, indicating that the stock price may rise further. The ADX is very strong at the level of 33, which indicates the directional strength is much higher to continue the uptrend.
In the case of a lower-side retracement, the major support level to watch for during any corrective swings is 50-day EMA. The stock price has a minor upper resistance at Rs 226. The overall structure remains favourable for traders, as the stock continues to move above all of its important moving averages, indicating a long-term upward trend.
GTPL Hathway Ltd engages in cable television and broadband services.
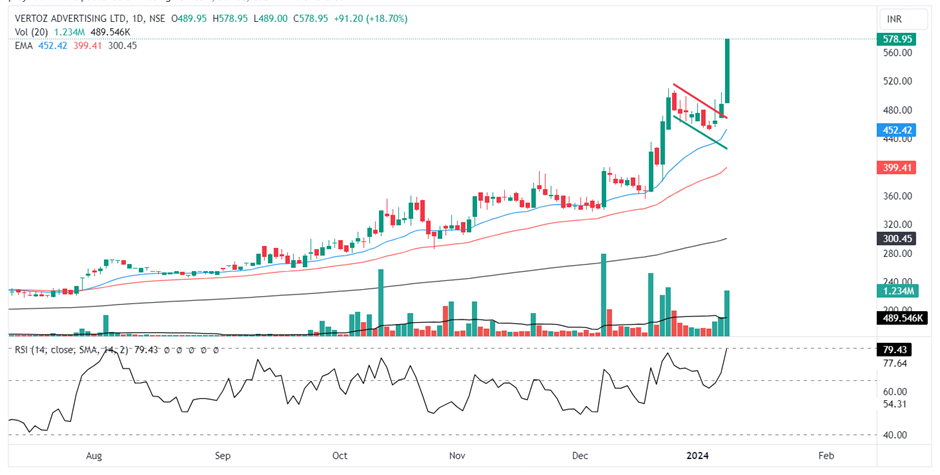
Dailly chart of Vertoz Advertising Ltd
Vertoz Advertising‘s stock is trading with a strong green daily candle and has given a breakout of the flag & pole chart pattern with a volume spike today.
On Monday, the stock began at Rs 489, then made an intraday high of Rs 585. The stock has been in a consolidation for the last 6 days forming a flag.
Vertoz Advertising has confirmed the breakout after closure of the Friday’s candle, which would continue the bullish trend. The stock is trading at its all-time high and may show a quick jump after today’s sustenance again. It witnessed a price volume breakout today, which was accompanied by a volume rise bigger than the ordinary trading day volume.
The relative strength index has also into the 65-80 range, indicating that the stock price may begin to rise sharply soon as it crosses the level of 80. The ADX is very strong at the level of 44, which indicates the directional strength is much higher to continue the uptrend.
The 20-day EMA is the fundamental support level to watch for during any corrective movements. The overall structure remains favourable for traders, with the stock trading above all of its major moving averages.
Vertoz Advertising Ltd. engages in the provision of advertising and market research.
Disclaimer: This blog has been written exclusively for educational purposes. The securities mentioned are only examples and not recommendations. The information is based on various secondary sources on the internet and is subject to change. Please consult with a financial expert before making investment decisions.
Published on: Jan 8, 2024, 4:01 PM IST
We're Live on WhatsApp! Join our channel for market insights & updates

Get the link to download the App

