Calculate your SIP ReturnsExplore

Comparing Your Mutual Fund Portfolio to the Benchmark: A Step-by-Step Guide

16 August 20245 mins read by Angel One
Choosing the right mutual funds and comparing them to benchmarks is key for wise investments. Learn to read benchmarks, interpret performances, and make informed decisions.
Comparing Your Mutual Fund Portfolio to the Benchmark: A Step-by-Step Guide
ShareShare on 1Share on 2Share on 3Share on 4Share on 5

“Benchmark your performance against your best competitor. Think how you can beat them next time.”Brian Tracy, Author of Earn what you’re really worth.

What’s a Benchmark?

Benchmark refers to any standard that helps in measuring the success of any particular investment. It serves as a starting point such as how athletes compare their running times with average ones to judge their performance.

Example: Nifty 50 is an Indian stock market index that includes 50 stocks that account for about half of all transaction volumes on the National Stock Exchange (NSE).

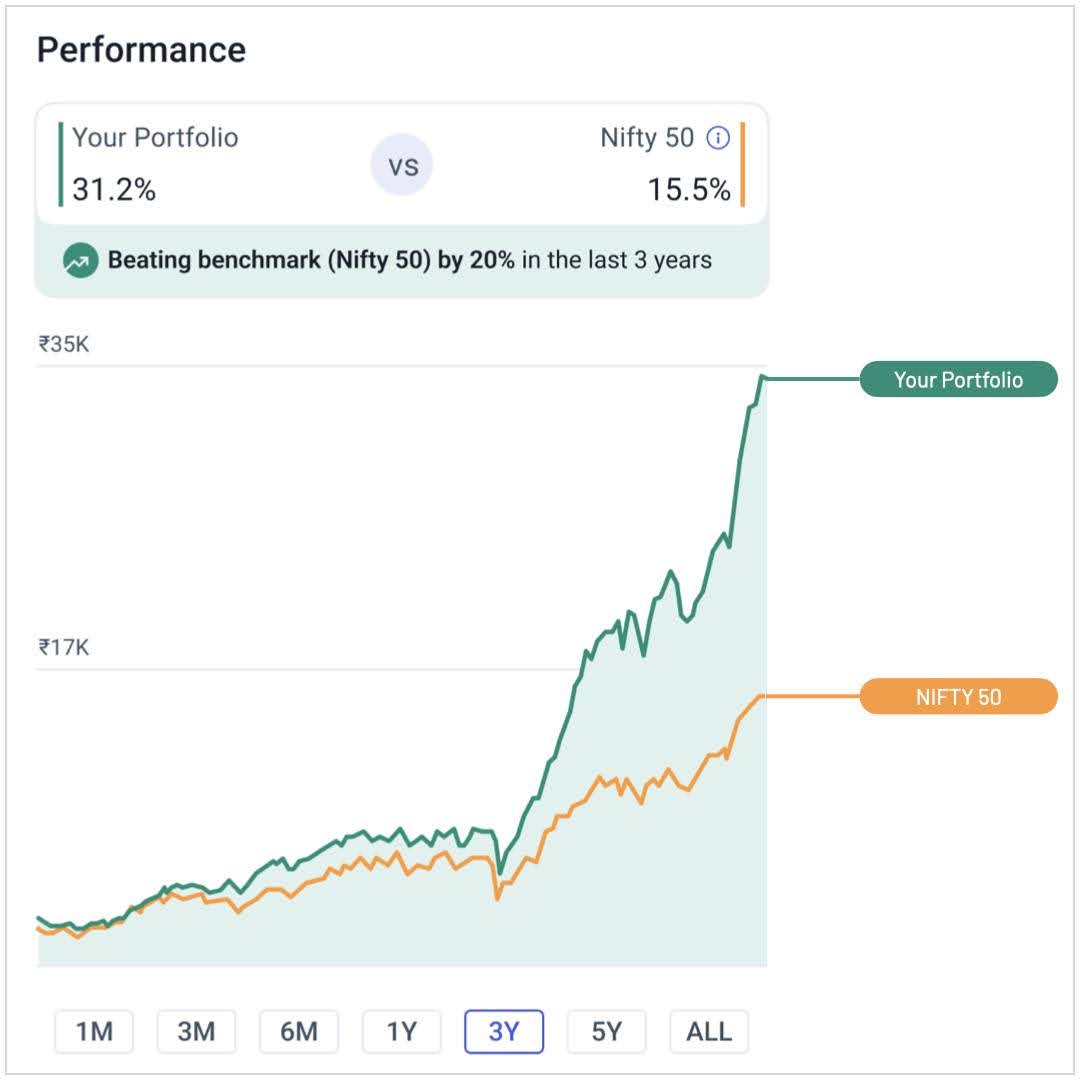
Objective: Comparing your Mutual Fund portfolio’s performance against Nifty 50 enables you to know whether it is performing well or not. It gives you something to measure your own investment strategy against.

Why Compare?

  • To compare your mutual fund with a benchmark indicates if your investments are growing as expected; therefore, it means your mutual fund is doing well against the benchmark.
  • The Nifty 50 represents highly valued companies in terms of their shares’ prices including top firms in India. By comparing your mutual fund with this benchmarking one sets high expectations for his/her investments

Reading the Graph

It is important to understand how to read performance graphs when evaluating your investments. This is the way to interpret the lines on a graph.

Understanding the Graph Lines

  • Green Line (Your mutual Fund): Over the past three years, this line shows how much your investment has grown. It demonstrates the history of your specific mutual fund over time.
  • Orange Line (Nifty 50): Over this period, this line represents a typical movement for Nifty 50 index stocks. It can be used for comparison purposes.

What to Look For

  • Above or Below: When your mutual fund’s green line is underneath the orange line (benchmark), it means that your mutual fund grows slower than Nifty 50 does. Alternatively, if green crosses above orange, it shows that your mutual fund is better off than the benchmark.
  • Performance Over Time: Take both lines going up which signifies moving high and higher all the time as opposed to downward trend. Comparing how they have moved will indicate to you how well or not so well your investment performed in relation to the market.

Interpreting the Performance

To make informed investment decisions, an accurate interpretation of performance data should be done.

What does this mean for you?

  • Losing to Benchmark by 20%: Your mutual fund has underperformed compared to the Nifty 50 by 20%. This significant underperformance indicates that your investment strategy may need a review.
  • Implications: Underperforming the benchmark suggests that your mutual fund isn’t keeping up with the broader market, which can impact your long-term investment goals.

Next Steps

Consider Your Options: Based on this performance data, you might want to adjust your investment strategy. This could involve reallocating assets, choosing different mutual funds, or increasing your investment in well-performing areas.

Understanding how to compare your mutual fund to a benchmark like the Nifty 50 is crucial for managing your investments effectively. By analysing performance graphs and interpreting key indicators, you can make informed decisions to optimise your investment strategy and achieve your financial goals. Click here to analyse your Mutual Fund Portfolio.

We're Live on WhatsApp! Join our channel for market insights & updates

Open Free Demat Account!

Enjoy Zero Brokerage on Equity Delivery

Join our 2 Cr+ happy customers

+91
Enjoy Zero Brokerage on Equity Delivery
4.4 Cr+DOWNLOADS
Enjoy Zero Brokerage on Equity Delivery

Get the link to download the App

Send App Link
Open Free Demat Account!
Enjoy Zero Brokerage on Stock Investments.