
As the leaves change and autumn sets in, India’s IT giants have revealed their financial performance for the September 2023 quarter. In this blog post, we’ll take you through the latest earnings reports and explore the key takeaways from their financials. Join us as we dive into the numbers and uncover the intriguing stories behind these tech giants’ quarterly results.
| TCS | Wipro | Infosys | HCL Tech | Tech Mahindra | |
| Sales | 59,692 | 22,516 | 38,994 | 26,672 | 12,864 |
| Net Profit | 11,380 | 2,667 | 6,215 | 3,833 | 505 |
| NPM % | 19.10% | 11.84% | 15.90% | 14.37% | 3.93% |
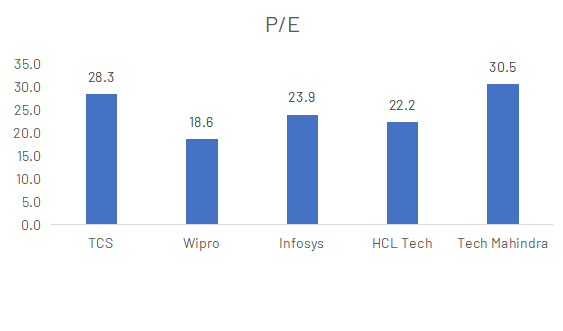
| EPS in Rs | 31 | 4.82 | 14.97 | 14.12 | 5.06 |
| TCS | Wipro | Infosys | HCL Tech | Tech Mahindra | |
| OPM % | 26% | 18% | 24% | 22% | 7% |
| Operating Profit | 15,746 | 3,970 | 9,440 | 5,929 | 914 |
| TCS | Wipro | Infosys | HCL Tech | Tech Mahindra | |
| Other Income | 1,006 | 740 | 632 | 365 | 264 |
| Other Income % of NP | 8.80% | 27.75% | 10.20% | 9.52% | 52.28% |
Impressive Profit Growth: Highlighting the substantial 8.7% rise in consolidated net profit.
Shareholder-Focused Move: Discussing the board’s approval of a ₹17,000 crore share buyback program and its terms.
Consistent Buyback Strategy: TCS’s fifth share buyback initiative in just six years.
Surpassing Analyst Expectations: TCS’s performance exceeded D-Street analysts’ forecasts amid global economic challenges.
Net Profit: Wipro’s consolidated net profit of ₹2,667.3 crore.
The company reported a 1.38% decrease in revenue, amounting to Rs 22,516 crore, which fell short of the estimated Rs 22,919.1 crore.
EBIT Decrease: Earnings Before Interest and Taxes (EBIT) declined by 11.26%, reaching Rs 3,075.7 crore, below the estimated Rs 3,517.3 crore. The EBIT margin was noted at 13.66%, a reduction from the estimated 15.44% and the previous rate of 15.17%.
Reduced Net Profit: The net profit experienced a significant decline of 14.41%, reaching Rs 2,267.3 crore, which was below the estimated Rs 2,905.9 crore.Top of F
Notable Profit Increase: Highlighting the 3.17% rise in net profit, which reached ₹6,212 crore, compared to ₹6,012 crore in the corresponding period the previous year.
Refined Revenue Growth Outlook: Discussing Infosys’ revised revenue growth guidance for the full year, now narrowed to 1-2.5% at the upper end.
Shareholder Benefits: Noting Infosys’ declaration of an interim dividend of ₹18 per equity share, with the record date set for October 25.
Robust Profit Growth HCL Technologies delivered a strong performance in Q2FY24, with a notable 9.8% rise in consolidated net profit, reaching ₹3,832 crore compared to ₹3,489 crore in the previous year. This growth in profitability reflects the company’s ability to thrive amidst macroeconomic challenges that persist in the IT sector.
Revenue Expansion In the same quarter, the IT services company’s revenue from operations surged by 8.04% to ₹26,672 crore, showcasing a remarkable year-on-year growth compared to ₹24,686 crore in the previous year. This expansion highlights HCL Technologies’ resilience and success in navigating the evolving IT landscape.
Deal Momentum HCL Technologies’ impressive profit growth was supported by a robust deal momentum, demonstrating the company’s strength in securing strategic partnerships and enhancing its market position. Despite industry-wide challenges, the company’s Q2FY24 results signify its ability to seize opportunities and drive growth.
Top of Form
Profit Downturn: Tech Mahindra’s Q1FY24 consolidated net profit plunged by 38% to ₹692.5 crore, compared to ₹1,131 crore in the previous year, owing to challenges in its core segments.
Revenue Uptick: Despite the profit decline, the company reported a 3.5% increase in consolidated revenue, with Q1FY24 revenue at ₹13,159 crore, up from ₹12,707 crore in the previous year.
EBITDA Squeeze: Earnings before interest, taxes, depreciation, and amortization (EBITDA) declined by 28.8% YoY, settling at ₹1,338 crore, reflecting the ongoing challenges faced by the IT major.
The IT Services market is poised for substantial growth, with projected revenues reaching US$22.41 billion in 2023. Notably, IT Outsourcing is the dominant force, with an estimated market volume of US$8.81 billion for the same year. This upward trajectory is expected to continue, showing an impressive annual growth rate (CAGR 2023-2028) of 13.97%. This growth will drive the market volume to a substantial US$43.09 billion by 2028. In a global context, the United States is set to generate the lion’s share of revenue, with an impressive US$454.70 billion expected in 2023.
Disclaimer: This blog has been written exclusively for educational purposes. The securities mentioned are only examples and not recommendations. It is based on several secondary sources on the internet and is subject to changes. Please consult an expert before making related decisions.
Published on: Oct 30, 2023, 3:27 PM IST
We're Live on WhatsApp! Join our channel for market insights & updates

Get the link to download the App

