
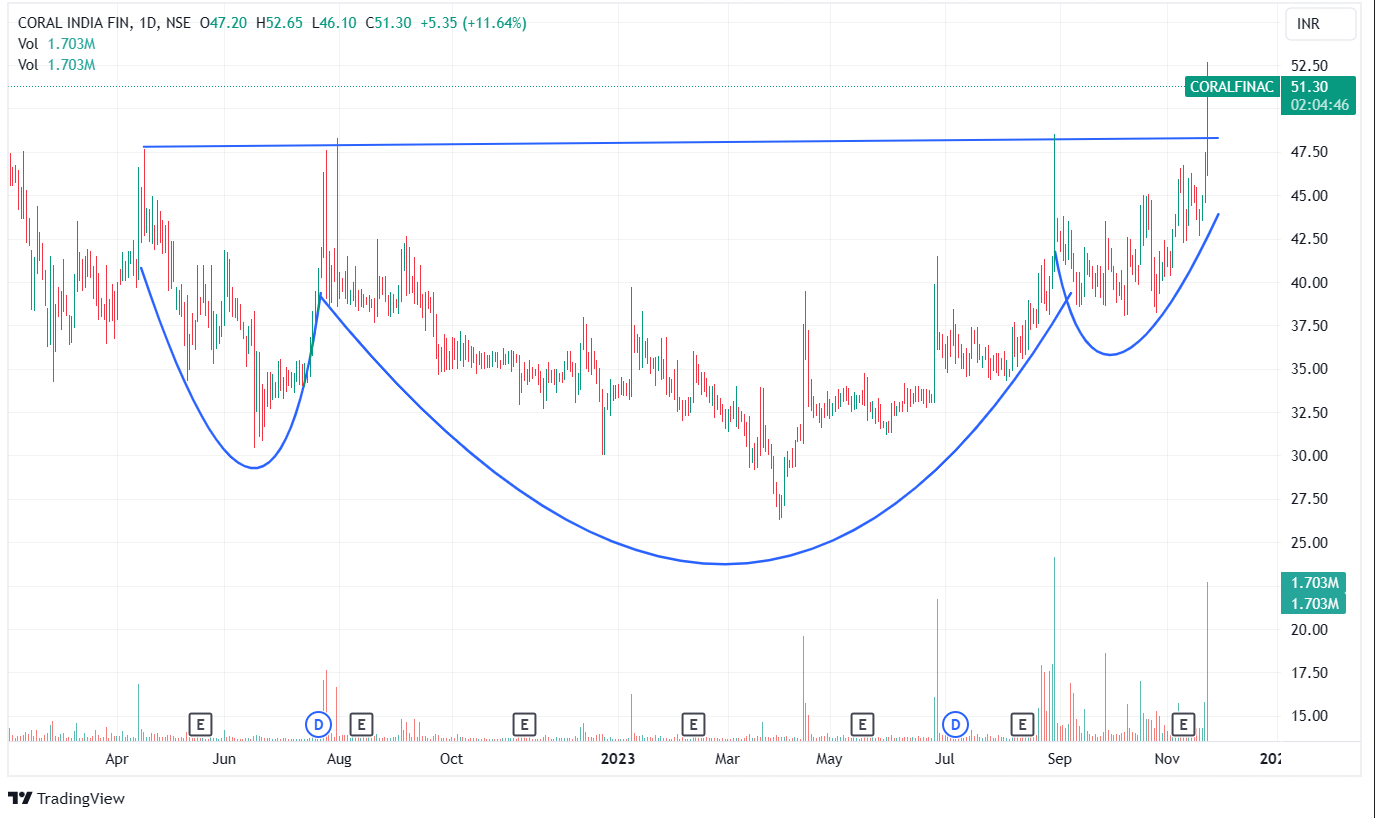
Coral India Finance & Housing Ltd is a low-priced breakout stock for today. The stock price is currently trading at Rs 51 and has witnessed a very clean break-out of the inverted head and shoulder chart pattern. The volume and other parameters of technical analysis are in sync with the breakout.
The inverted head and shoulders pattern is a bullish reversal chart pattern that indicates a potential change in trend from downtrend to uptrend. It is considered one of the most reliable reversal patterns and is often used by technical analysts to identify trading opportunities.
The pattern consists of three troughs, with the middle trough (the head) being the lowest, and the other two troughs (the shoulders) being slightly higher. The pattern is also characterized by a neckline, which is formed by connecting the highs of the two shoulders.
When the price breaks above the neckline, it is considered a confirmation of the bullish reversal. The target price for the pattern is typically equal to the height of the head, measured from the neckline.
In the daily chart of Coral India Finance & Housing, it has formed a clear and crisp inverted head and shoulder chart pattern. Today the stock price has broken the neckline with a volume spurt of 8.88 times the average daily volume. The stock price is trading above all short-term and long-term moving averages.
The relative strength index of the stock is in a bullish range at the level of 73.27, which confirms the strength of the price. When compared to the Nifty 50 index, the stock is doing much better with higher relative strength.
The possible upper level for the stock to reach is around Rs 70, as the height of the head is around 20 points. The ADX is below the 25 level, suggesting lower momentum strength, but as soon as stocks pick up momentum, the ADX also adds strength to the coming uptrend.
The stock is at its multi-year high and has generated 55.66% returns in the last 6 months of the time period.
Coral India Finance and Housing Ltd provides Construction, Investment, development & maintenance of properties and related services.
Disclaimer: This blog has been written exclusively for educational purposes. The securities mentioned are only examples and not recommendations. It is based on several secondary sources on the internet and is subject to changes. Please consult an expert before making related decisions.
Published on: Nov 22, 2023, 2:32 PM IST
We're Live on WhatsApp! Join our channel for market insights & updates

Get the link to download the App

