
DCM Shriram Industries is currently trading at Rs 166 with a chart pattern breakout sustaining the momentum. The stock price has formed a bullish rectangle chart pattern, which is a trend continuation pattern.
A rectangle chart pattern is a technical analysis pattern that occurs when the price of a security moves within a defined range for a period of time. This pattern is considered to be a continuation pattern, meaning that it is likely to be followed by a continuation of the previous trend.
A rectangle chart pattern is formed when the price of a security moves between two parallel horizontal lines, one representing support and the other representing resistance, Tests each of these lines multiple times, indicating a period of consolidation or indecision and fails to break decisively above or below the range for an extended period of time
Bullish rectangle: This pattern occurs after an uptrend and is characterized by support and resistance levels that are both rising. A breakout from a bullish rectangle is typically followed by a continuation of the uptrend.
Traders can use rectangle chart patterns to identify potential entry and exit points for trades. A breakout above the resistance level of a rectangle pattern is typically seen as a buy signal, while a breakout below the support level is typically seen as a sell signal.
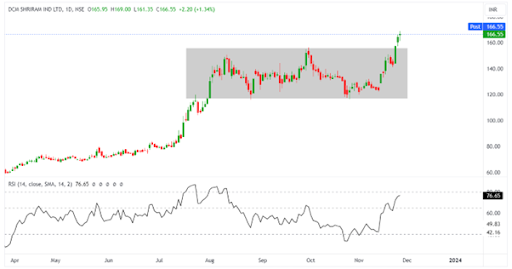
In the above technical chart of DCM Shriram Industries, the stock price has formed a bullish rectangle chart pattern. It is a bullish rectangle chart pattern, as the prior trend was bullish and the price is trading between resistance and support. The stock has traded in the range of Rs 116 and Rs 156 for four months, and on November 23, 2023, the price was given a breakout of the rectangle chart pattern. Looking at the other supportive parameters, the RSI is trading at a level of 76, which is in the bullish zone but not overbought yet. This shows the strength of the price. The stock has just rallied from support by breaking its 50-day EMA and also honouring it as support and resistance. The volume trading since the breakout is on the higher side than the daily average. The price may try to sustain above the breakout level and try to retest the same, and then the uptrend may continue as it was before. The potential reach levels might fall at Rs 196 as the height of the rectangle is 40 points.
DCM Shriram Industries Ltd. engages in the manufacture and sale of sugar, alcohol, fine chemicals, rayon tire cords, and textiles. It operates through the following segments: Sugar, Industrial Fibers and Related Products, and Chemicals.
Disclaimer: This blog has been written exclusively for educational purposes. The securities mentioned are only examples and not recommendations. It is based on several secondary sources on the internet and is subject to changes. Please consult an expert before making related decisions.
Published on: Nov 28, 2023, 6:23 PM IST
We're Live on WhatsApp! Join our channel for market insights & updates

Get the link to download the App

