Investing in mutual funds is a peaceful endeavour. There’s no need to constantly monitor individual stock performances, identify breakouts, or follow market trends. Before investing in mutual funds, investors typically analyse the category, expense ratio, and historical performance. Additionally, they may scrutinize the fund manager’s qualifications, review their portfolio and assess the performance of other funds under their management.
Some investors also consider the fund’s Asset Under Management (AUM) size, believing that a larger AUM indicates a better fund, while a smaller AUM suggests potential deterioration. It’s crucial to note that investor confusion about AUM may stem from inadequate guidance from financial planners.
While most investors may overlook the inception date of funds, they must consider this aspect before delving into analysis. For instance, let’s consider two Asset Management Companies (AMCs) that both started in February 2004 and belonged to the same category, such as Small Cap funds. Fast forward to February 2024, after two decades have passed.
Suppose one fund’s AUM has experienced significant growth, increasing from Rs 100 crore to Rs 20,000 crore during the same period. On the other hand, the competing fund is struggling, having reached only Rs 1500 crore, despite receiving inflows. The difference in the growth rates between the two funds AUM underscores the importance of considering the inception date, as it plays a crucial role in understanding the performance and trajectory of each fund over the long term.
Hence, the inception date of a fund matters. It provides a historical record of the fund’s performance, reflects the manager’s experience, and helps assess its behaviour in different market conditions. Additionally, it indicates the fund’s popularity and success by tracking the growth of its assets over time.
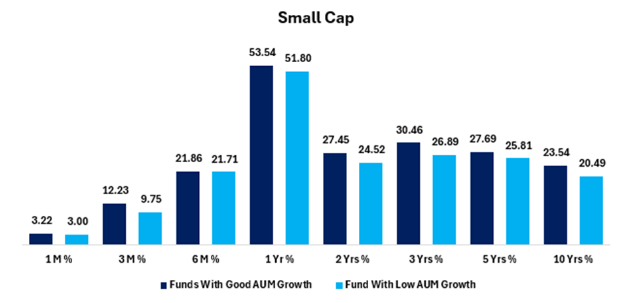
To find the answer, we analysed all three categories of funds – Small Cap, Mid Cap, and Large Cap. We bifurcated the funds into those whose AUM has grown and those that have not showcased growth in their AUM compared to their competitors since inception until today. We calculated the average return of those funds over different periods. Let’s start with Small, then Mid, and finally Large Cap funds.
| Small Cap >> Returns | 1 M % | 3 M % | 6 M % | 1 Yr % | 2 Yrs % | 3 Yrs % | 5 Yrs % | 10 Yrs % |
| Funds With Good AUM Growth | 3.22 | 12.23 | 21.86 | 53.54 | 27.45 | 30.46 | 27.69 | 23.54 |
| Fund With Low AUM Growth | 3.00 | 9.75 | 21.71 | 51.80 | 24.52 | 26.89 | 25.81 | 20.49 |

The reason for analyzing Small Cap funds first is that they are presenting a perfect picture. Funds with substantial AUM growth have consistently outperformed those with lower AUM growth since their inception. However, the difference is not significant initially, but over time, when compounding works, these small differences lead to significant gaps. In this category, during every time period, funds with robust AUM growth have delivered greater returns compared to those with low AUM growth.
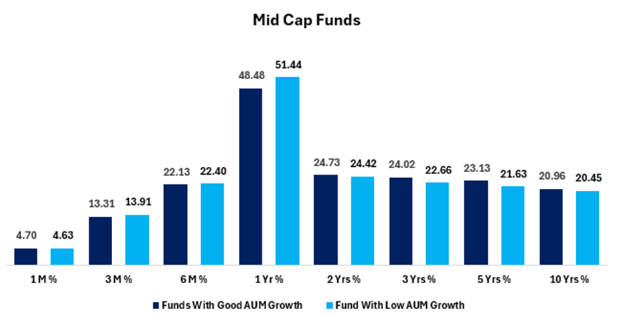
| Mid Cap | 1 M % | 3 M % | 6 M % | 1 Yr % | 2 Yrs % | 3 Yrs % | 5 Yrs % | 10 Yrs % |
| Funds With Good AUM Growth | 4.70 | 13.31 | 22.13 | 48.48 | 24.73 | 24.02 | 23.13 | 20.96 |
| Fund With Low AUM Growth | 4.63 | 13.91 | 22.40 | 51.44 | 24.42 | 22.66 | 21.63 | 20.45 |

In the Midcap space, a mixed correlation between AUM growth and fund performance was observed; however, establishing a clear winner is not feasible. Over the 3 months, 6 months, and the past 1-year time frames, funds with low AUM growth have outperformed, while in the remaining time frames, the trend aligns with that observed in the Small Cap category.
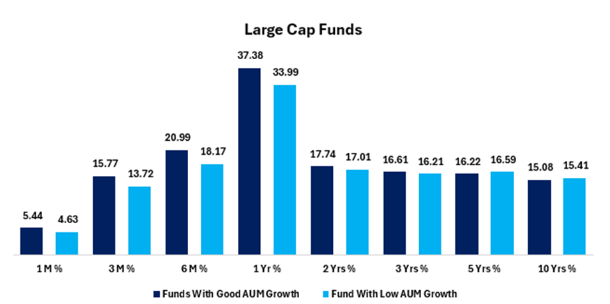
| Large Cap | 1 M % | 3 M % | 6 M % | 1 Yr % | 2 Yrs % | 3 Yrs % | 5 Yrs % | 10 Yrs % |
| Funds With Good AUM Growth | 5.44 | 15.77 | 20.99 | 37.38 | 17.74 | 16.61 | 16.22 | 15.08 |
| Fund With Low AUM Growth | 4.63 | 13.72 | 18.17 | 33.99 | 17.01 | 16.21 | 16.59 | 15.41 |

Furthermore, in Large Cap Funds, during the majority of time periods, funds with good AUM growth have clearly outperformed, exhibiting a significant difference in returns in certain periods such as 3 months, 6 months, and 1 year compared to funds with low AUM growth since their inception date.
Conclusion:
Comparing the fund’s AUM growth since its inception with its historical performance, one can infer that funds with substantial AUM growth are preferable. Alternatively, it can be stated that funds demonstrating strong performance attract investor funds, leading to a redirection of investments from underperforming funds.
AUM is a good way to see how popular and successful a fund is (since more money comes in when the fund is doing well), but it shouldn’t be the only thing you look at when choosing mutual funds.
Ready to watch your savings grow? Try our SIP Calculator today and unlock the potential of disciplined investing. Perfect for planning your financial future. Start now!
Disclaimer: This blog has been written exclusively for educational purposes. The securities mentioned are only examples and not recommendations. It is based on several secondary sources on the internet and is subject to changes. Please consult an expert before making related decisions.
Published on: Mar 7, 2024, 10:35 AM IST
We're Live on WhatsApp! Join our channel for market insights & updates
