
The shares of Dr. Lal PathLabs Ltd are trading around Rs 2220 on BSE. Today it opened at Rs 2175.05, almost flat opening from the previous day’s closing price of Rs 2168.25. Its 52-week highs and lows are Rs 2752.15 and Rs 1762.70. The current market capitalisation of the company is Rs 18526.78 Crore. The stock is trading at Price to earnings ratio of 77.4 times in the market.
The stock was seen facing a hurdle (resistance) as defined by the downward-sloping trendline which was seen plotted from subsequent highs from February 2023.
In the previous week, the stock once again encountered resistance from the same trend line and formed an inverted hammer candle, and failed to cross the trend line, indicating continued bearish activity.
However, in the current week, it has demonstrated good strength and broke the trend line. There is a good possibility that it may surpass the high point of the inverted hammer candle formed last week and close above it.
By examining the chart, we can observe that the next significant resistance level is approximately Rs 2600, which is around 17% higher than the current levels. Additionally, there is a psychological level of Rs 2500 to consider.
On the support side, the stock has established a solid support base of around Rs 1800 and has received multiple times support from that level. The most recent support was witnessed in March 2023, and it is currently trading at Rs 370 higher than the March low of Rs 1850. Prior to that, it also took support at the same levels in May 2022.
Analysing the candle for the current week, it displays significant strength. Notably, today marks the second day of the week, and the stock is trading only a mere Rs 32 below the previous week’s high of Rs 2252. Buyers looking confident in purchasing at this level, indicating a potential upward movement for the stock.
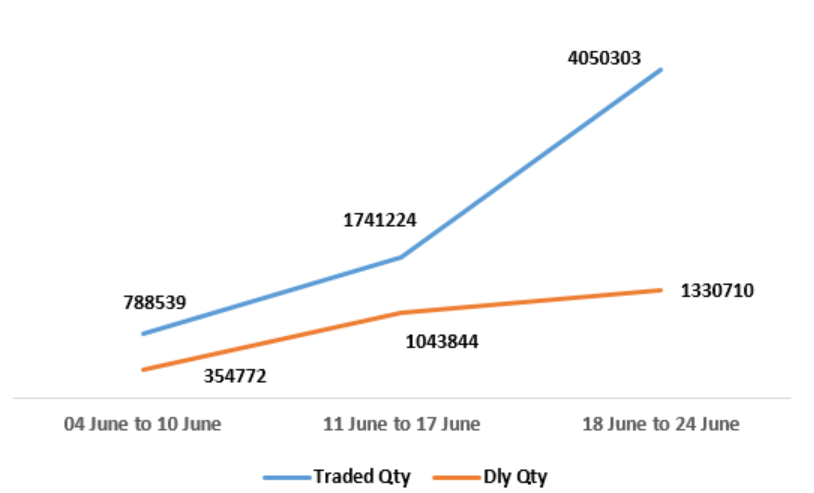
There has been a significant surge in volumes of the stock. Both the trading volumes and the delivery volumes, indicating the number of shares bought and held by investors, have exhibited an upward trend.
Presented below are weekly charts illustrating the volume trends in the stock.
On a daily basis, the Relative Strength Index (RSI) is above 60 and currently, it is at 66.90 whereas on a weekly basis, it is at 59.71 and planning to cross 60. Investors may perceive this stock as a favourable investment option.
If we check the company’s financials, annual revenue declined by 3.38% from Rs 2087 Crore to Rs 2017 Crore in FY23. The operating profit of the company is Rs 490 Crore with an operating profit margin of 24%. The net profit of the company is Rs 241 Crore.
Promotors holding in the company is 55.03%, whereas FIIs and DIIs hold 24.89% and 6.56% respectively.
Furthermore, it is also listed in the Future and Option (F&O) market and investors must check the future and options open interest. It will be an important parameter to check before making any decision.
Published on: Jun 27, 2023, 5:19 PM IST
We're Live on WhatsApp! Join our channel for market insights & updates

Get the link to download the App

