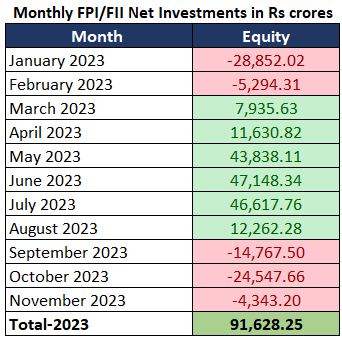
In the broader context, the current macroeconomic landscape in India is witnessing a delicate balancing act. The government’s focus on infrastructure development, coupled with ongoing economic reforms, strives to bolster growth. However, challenges such as inflationary pressures and global economic uncertainties require prudent navigation. As India continues on its growth trajectory, a multifaceted approach, incorporating both domestic and international considerations, remains crucial for sustainable economic resilience.
| Sr. No. | Sectors | Equity (Rs Crore) | Growth in % | Growth in Rs Crore | ||||||
| Aug-23 | Sep-23 | Oct-23 | Oct-Sept | Sept- Aug | Oct-Aug | Oct-Sept | Sept- Aug | Oct-Aug | ||
| 1 | Automobile and Auto Components | 3,46,220 | 3,56,446 | 3,48,871 | 0.77% | 2.95% | 0.77% | -7,575 | 10,226 | 2,651 |
| 2 | Capital Goods | 2,22,460 | 2,24,743 | 2,19,719 | -1.23% | 1.03% | -1.23% | -5,024 | 2,283 | -2,741 |
| 3 | Chemicals | 99,100 | 95,978 | 91,842 | -7.32% | -3.15% | -7.32% | -4,136 | -3,122 | -7,258 |
| 4 | Construction | 1,10,354 | 1,19,216 | 1,13,697 | 3.03% | 8.03% | 3.03% | -5,519 | 8,862 | 3,343 |
| 5 | Construction Materials | 93,610 | 94,657 | 94,617 | 1.08% | 1.12% | 1.08% | -40 | 1,047 | 1,007 |
| 6 | Consumer Durables | 1,88,072 | 1,86,907 | 1,81,013 | -3.75% | -0.62% | -3.75% | -5,894 | -1,165 | -7,059 |
| 7 | Consumer Services | 1,45,467 | 1,50,100 | 1,47,430 | 1.35% | 3.18% | 1.35% | -2,670 | 4,633 | 1,963 |
| 8 | Diversified | 3,692 | 3,853 | 3,788 | 2.60% | 4.36% | 2.60% | -65 | 161 | 96 |
| 9 | FMCG | 3,76,836 | 3,78,489 | 3,73,611 | -0.86% | 0.44% | -0.86% | -4,878 | 1,653 | -3,225 |
| 10 | Financial Services | 17,53,402 | 17,74,155 | 17,14,522 | -2.22% | 1.18% | -2.22% | -59,633 | 20,753 | -38,880 |
| 11 | Forest Materials | 2,247 | 2,607 | 2,565 | 14.15% | 16.02% | 14.15% | -42 | 360 | 318 |
| 12 | Healthcare | 2,90,022 | 2,96,757 | 2,82,862 | -2.47% | 2.32% | -2.47% | -13,895 | 6,735 | -7,160 |
| 13 | Information Technology | 5,20,205 | 5,33,829 | 5,13,289 | -1.33% | 2.62% | -1.33% | -20,540 | 13,624 | -6,916 |
| 14 | Media, Entertainment & Publication | 21,230 | 20,687 | 19,632 | -7.53% | -2.56% | -7.53% | -1,055 | -543 | -1,598 |
| 15 | Metals & Mining | 1,59,358 | 1,59,296 | 1,49,208 | -6.37% | -0.04% | -6.37% | -10,088 | -62 | -10,150 |
| 16 | Oil, Gas & Consumable Fuels | 4,68,400 | 4,61,509 | 4,45,116 | -4.97% | -1.47% | -4.97% | -16,393 | -6,891 | -23,284 |
| 17 | Power | 1,87,379 | 1,95,336 | 1,85,421 | -1.04% | 4.25% | -1.04% | -9,915 | 7,957 | -1,958 |
| 18 | Realty | 76,449 | 80,489 | 83,649 | 9.42% | 5.28% | 9.42% | 3,160 | 4,040 | 7,200 |
| 19 | Services | 95,095 | 91,973 | 88,260 | -7.19% | -3.28% | -7.19% | -3,713 | -3,122 | -6,835 |
| 20 | Telecommunication | 1,35,343 | 1,45,857 | 1,43,209 | 5.81% | 7.77% | 5.81% | -2,648 | 10,514 | 7,866 |
| 21 | Textiles | 19,278 | 18,652 | 19,034 | -1.27% | -3.25% | -1.27% | 382 | -626 | -244 |
| 22 | Utilities | 859 | 886 | 868 | 1.05% | 3.14% | 1.05% | -18 | 27 | 9 |
| 23 | Sovereign | 0 | 0 | 0 | NA | NA | NA | NA | NA | NA |
| 24 | Others | 13,272 | 16,233 | 15,043 | 13.34% | 22.31% | 13.34% | -1,190 | 2,961 | 1,771 |
| Grand Total | 53,28,349 | 54,08,654 | 52,37,268 | -1.71% | 1.51% | -1.71% | -1,71,386 | 80,305 | -91,081 | |
Source – NSDL website
In the period from August to October 2023, certain sectors stood out for their remarkable performances and challenges within the Foreign Portfolio Investment (FPI) landscape.
Conversely, some sectors faced notable challenges during this period.
The comprehensive analysis of FPI investment data from August to October 2023 reveals a nuanced picture of India’s economic landscape. The data reflects the sensitivity of sectors to external factors and the resilience of certain industries amid uncertainties.

Disclaimer: This blog has been written exclusively for educational purposes. The securities mentioned are only examples and not recommendations. It is based on several secondary sources on the internet and is subject to changes. Please consult an expert before making related decisions.
Published on: Nov 10, 2023, 2:08 PM IST
We're Live on WhatsApp! Join our channel for market insights & updates
