
Established in 1978 in Hyderabad, Gland Pharma has evolved from a contract manufacturer of small-volume liquid parenteral products to one of the largest injectable-focused companies globally. Its remarkable journey has led to a robust presence in over 60 countries, including the United States, Europe, Canada, Australia, India, and other significant markets.
Operating primarily under a business-to-business (B2B) model, Gland Pharma has an outstanding track record in developing, manufacturing, and marketing sterile injectables. The company offers a diverse portfolio of injectables, including vials, ampoules, pre-filled syringes, lyophilized vials, dry powders, infusions, oncology, and ophthalmic solutions. A notable achievement is its pioneering of Heparin technology in India, setting the company apart in the pharmaceutical industry.
Technically, Gland Pharma’s stock is trading at the pivot of a 24-week cup and handle pattern with above-average volume, indicating a potential breakout. The stock’s Relative Strength (RS) line is rising and currently stands at a robust 62, reflecting strong momentum.
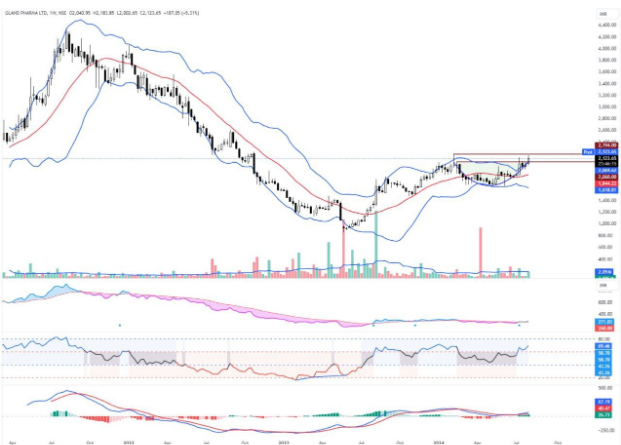
The stock is trading above all long and medium-term moving averages, which are in an uptrend and ascending order. Specifically, it is trading 24.37% above the 40-week average and 21.47% above the 10-week average. This upward trend is supported by expanding weekly Bollinger Bands after a prolonged period of tight contraction, suggesting increasing volatility and potential for significant price movement.
Several technical indicators are signaling bullish trends for Gland Pharma. The Moving Average Convergence Divergence (MACD) has given a bullish signal after hovering around the zero line for an extended period. The Relative Strength Index (RSI) has shifted into the bullish zone. The stock is trading above the Anchored Volume Weighted Average Price (VWAP) resistance and has cleared all other resistances. Additionally, the Stochastic RSI shows a bullish signal, and the Know Sure Thing (KST) indicator is about to give a bullish signal. The Elder Impulse System has formed a bullish bar, and the Relative Performance Line is above the 21-day Exponential Moving Average (EMA), which is also a positive sign.
Disclaimer: This blog has been written exclusively for educational purposes. The securities mentioned are only examples and not recommendations. It is based on several secondary sources on the internet and is subject to changes. Please consult an expert before making related decisions.
Published on: Aug 1, 2024, 6:04 PM IST
We're Live on WhatsApp! Join our channel for market insights & updates

Get the link to download the App

