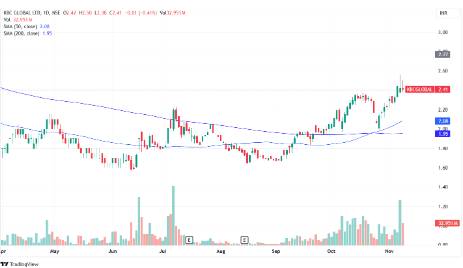
KBC Global’s share price has recently attracted investor attention by reaching a fresh 42-week high, despite a volatile market. Notably, the stock is trading above its 20, 50, and 200-day moving averages (DMA), with these key averages aligned favourably. This alignment highlights a significant technical event: the 50-DMA has crossed above the 200-DMA, forming a “golden crossover” that typically signals a strong bullish trend and potential for further gains.

KBC Global’s RSI level is currently around 53, which indicates moderate momentum — neither overbought nor oversold. A move above 60 could signal stronger bullish momentum. Presently, RSI leans toward the bullish side, supporting the case for a potential rally if it climbs further.
The Moving Average Convergence Divergence (MACD) indicator also presents a bullish crossover, as the MACD line has moved above the signal line, a classic buy signal in technical analysis. A widening gap between these lines would reinforce bullish sentiment and suggest the rally may have room to run.
The Average Directional Index (ADX) reading above 20 suggests a moderately strong trend for KBC Global, with the +DI (Directional Indicator) line above the -DI line. This positioning indicates buyers currently have more influence than sellers, adding strength to the upward trend.
As the golden crossover, MACD, and ADX align in support of a bullish outlook, KBC Global may continue to attract interest in the days to come. Investors should watch for these technical signals to confirm sustained momentum.
Disclaimer: This blog has been written exclusively for educational purposes. The securities mentioned are only examples and not recommendations. It is based on several secondary sources on the internet and is subject to changes. Please consult an expert before making related decisions.
Published on: Nov 8, 2024, 5:29 PM IST
We're Live on WhatsApp! Join our channel for market insights & updates
