
On Wednesday, the NSE benchmark Nifty 50 index traded within a narrow range, marking its narrowest daily range for May, with a meager range of about 146 points.
On the daily chart, Nifty formed a bearish candle with minor upper and lower shadows, ending its three-day winning streak with a marginal cut. Profit-taking was observed in FMCG, Auto, and Banking stocks.
The technical analysis of Tata Motors reveals a concerning performance outlook. The stock witnessed a significant decline following its earnings announcement, accompanied by a notable surge in trading volumes, indicating a distribution phase. Notably, it opened with a notable gap-down and registered its highest single-day trading range in a considerable period, suggesting increased volatility. Currently, Tata Motors is exhibiting a 45-day rectangle pattern at the top, with its price closing at parallel support levels. Additionally, it is trading below all key short-term moving averages, which are trending downward, and also below the moving average ribbon. The stock’s price is approximately 4.60% below the 50-day moving average. Bollinger Bands have begun to expand, signaling a potential impulsive downward movement. Furthermore, the MACD line is positioned below the zero line, and the RSI has shifted into the bearish zone, indicating a bearish momentum. Both the KST and Stochastic RSI are in bearish mode. In conclusion, the technical indicators collectively suggest that Tata Motors is likely to experience a breakdown. A move below the Rs. 940 level is considered negative, with potential downside targets around Rs. 900. It is advisable for investors to maintain a stop-loss at Rs. 955 to manage risk effectively.
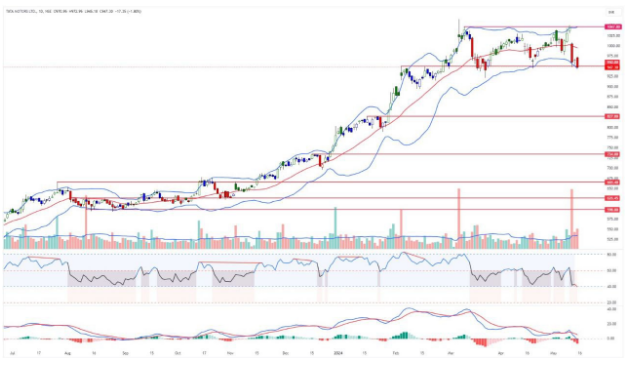
The stock has gained nearly 21% on a year-to-date basis, but May saw a decline of 6%. Whether the top has been formed depends on the weekly closing; a move below the Rs. 940 level signals caution.In summary, Tata Motors stock is poised for a breakdown, with a move below Rs. 940 being negative, potentially testing Rs. 900. It’s advised to maintain a stop loss at Rs. 955.
Disclaimer: This blog has been written exclusively for educational purposes. The securities mentioned are only examples and not recommendations. It is based on several secondary sources on the internet and is subject to changes. Please consult an expert before making related decisions.
Published on: May 16, 2024, 12:08 PM IST
We're Live on WhatsApp! Join our channel for market insights & updates

Get the link to download the App

