
Markets opened on a positive note and traded higher throughout the day, closing near a new lifetime high. One stock from the capital goods sector broke out from weekly and daily continuation price patterns by rallying more than 5% in today’s trading session.
Hitachi Energy India Ltd (formerly known as ABB Power Products and Systems India Ltd.) was formed in 2019 as a Joint Venture between Hitachi and ABB’s Power Grids and is headquartered in Bangalore, India. The company serves utility and industry customers, with a complete range of engineering, products, solutions, and services in areas of Power technology.
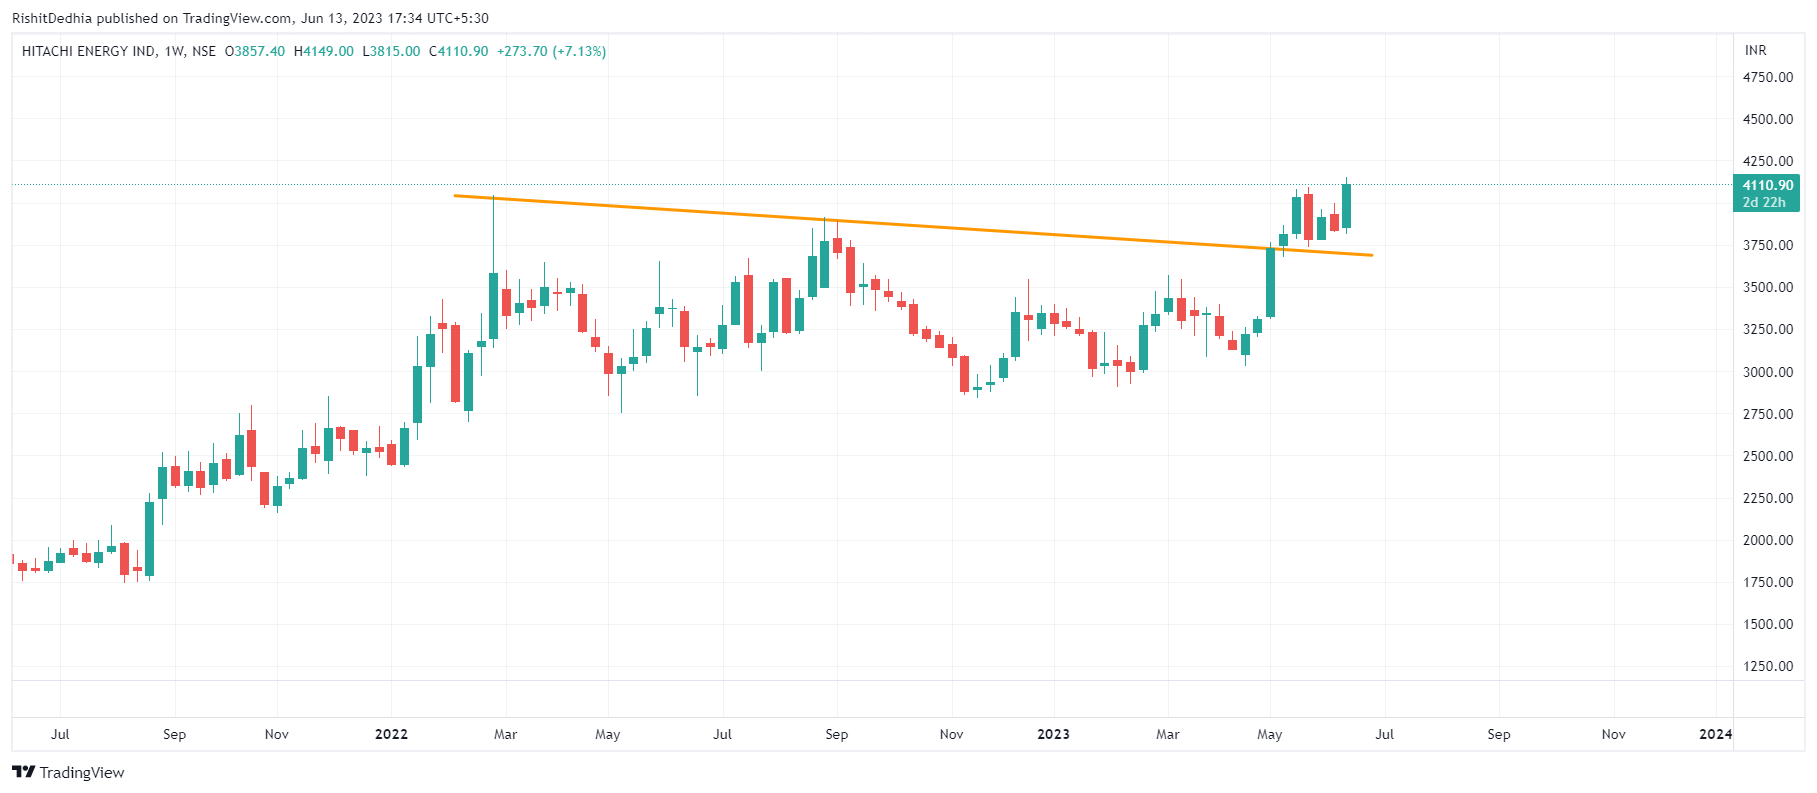
Technically, on the weekly chart, it formed a continuation pattern named “Bullish Up-Flag”, a formation in which the trend line is drawn from the high of last week of February 2022 (Rs 4042.60) and the last week of August 2022 (Rs 3915) will act as breakout trendline of this weekly pattern. Interestingly, it registered a breakout of this pattern in the second week of May 2023 as it closed above this trendline and rallied higher. The minimum possible targets of this pattern will be around Rs 4890 which is more than 30% higher than the trendline level of Rs 3764.
After such a long-term breakout, it witnessed some throwback rally and again tested the weekly trendline support level. It consolidated for more than 15 days in the range of Rs 4094.50 on the higher side and Rs 3738.65 on the lower side. If we draw the trendline from the highs of May 23, 2023 (Rs 4094.50) and June 07, 2023 (Rs 4000) we’ll again get the trendline of a daily continuation pattern.
Interestingly, today it surged more than 5% and closed around the day’s high. This trading action registered a breakout of this pattern and the minimum possible targets of this pattern will be around Rs 5000 which is around 25% higher than the breakout level (Rs 4000).
Considering all these factors, strong bullishness is confirmed on the daily and weekly chart. Thus, it should be on the radar for buying opportunities in upcoming sessions.
Published on: Jun 13, 2023, 5:37 PM IST
We're Live on WhatsApp! Join our channel for market insights & updates

Get the link to download the App

