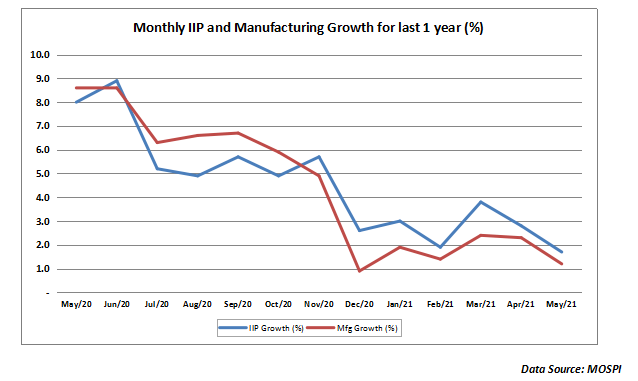
The index of industrial production for the month of May came in at 1.7% continuing its downward trend over the last one year. As the chart below depicts, the IIP number has virtually fallen in tandem with the manufacturing growth, which remains the largest component of the IIP. In fact, it would be interesting to see the IIP numbers for June which will be announced in the month of August. There are already worries that the IIP in the month of June will take a hit due to corporates slowing down production ahead of the launch of GST on July 01st. Most businesses focused largely on disposing off their outstanding inventory to avoid any accounting issues and that means regular production took a hit. That is already visible from the PMI-Manufacturing number which showed pressure on output.

IIP for the month of May 2017 at 1.7% was lower than the previous two months largely led downwards by the manufacturing sector. With tepid demand ahead of the GST launch, production saw weakness across sectors. Among the 3 key components of IIP viz. Mining, Manufacturing and Electricity, only electricity recorded a healthy 8.5% growth. While this is partially due to a positive regulatory environment for electricity producers, it is also due to the inclusion of alternative energy sources under the new format of IIP measurement. But, mining and manufacturing were a disappointment in the month of May. While mining recorded negative growth of (-0.9%), manufacturing saw a tepid growth of just 1.2%. With manufacturing having an inordinately large 77% weightage in the IIP, the impact of tepid manufacturing has been directly reflected on the overall IIP number.
What were the positive contributors to the IIP basket?
On the positive side, digestive enzymes and antacids contributed majorly to the IIP but this impact could be more because enzymes were recently added to the IIP list. The overall impact of pharma sector has been negative as we will see in the case of active pharma ingredients (APIs) and formulations. Gold jewellery saw a sharply positive growth during the month and that is evident from the sharp increase in the imports of gold in the recent quarter ended June. With heavy demand ahead of the festival season and gold prices remaining subdued, there has been a strong spurt in jewellery production in the month of May. This momentum is likely to sustain in the month of June too. There was sharp increase in the production of diesel and two-wheelers during the month. With regards to diesel, the sharp growth in HSD has been sustained as more capacity has come on stream. On the two-wheelers front, we are seeing production higher as demand is expected to pick up after the harvest and also the lag effect of remonetization is finally beginning to show up. Of course, the Hot Rolled Coils being a key steel product has also seen a sharp increase in production on the back of a very favourable regulatory scenario which has induced steel producers to expand the production to the extent of making India a net exporter of steel from being a net importer.
What were the negative contributors to the IIP basket?
Among the negative contributors to the IIP, auto ancillaries like axles and air filters showed de-growth for the month of May 2017. Within the pharma space, while digestive enzymes showed a positive trend due to their inclusion in the index, APIs and formulations showed a negative growth for the month of May. Commercial vehicles continued to report tepid sales as the aftermath of the demonetization continued to linger on the CV sector. With construction segment showing weak expansion, the demand for electrical equipment and fittings was also tepid during the month. The liquor segment also came under pressure as the restrictions on sale in liquor in some states as well as the ban on sale of liquor on highways took its toll on the production numbers.
In terms of user-based classification, capital goods continued to show negative growth of (-3.9%). Although this has improved over the last 2 years, it is still indicative that the revival in capital cycle is some time away. While the consumer non-durables segment has seen a positive growth of 7.9% due to a major thrust by FMCG companies, the consumer durables segment continues to show tepid growth as last mile replacement demand continues to be weak.
To cut a long story short, the IIP continues to disappoint for the month of June. The RBI is unlikely to look at this as a signal to cut rates as industry is still operating at less than 70% capacity. Also the shortfall in bank credit has been largely made up by the bond market borrowings. However, weak IIP number will continue to put pressure on the GDP growth and on the quarterly performance of Indian companies. That trend will become clearer as the Q1 results start coming out for this fiscal.
Published on: Jul 14, 2017, 12:00 AM IST
We're Live on WhatsApp! Join our channel for market insights & updates
