
If you are concerned about your investment portfolio due to the rising India VIX, as a long-term investor, you shouldn’t fret over its daily fluctuations unless it surpasses certain significant levels based on past data. However, if you are a trader or short-term investor, it might raise concerns about the direction in which you should build your position. You might consider waiting until it stabilises or moves towards lower levels.
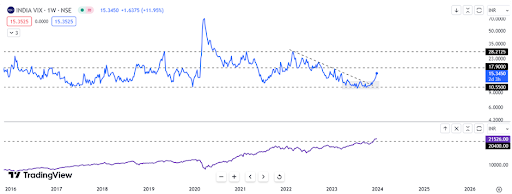
Traders and short-term investors may express concerns about the rising India VIX, indicating expected near-term volatility, which might pose challenges in generating profits for many participants. Currently strongly trading above 15.30, historical observations suggest that India VIX has typically found strong support around the level of 10 and tends to change direction within the vicinity of this level, give or take a small margin. This time, it remained in consolidation for approximately 150 to 180 days, fluctuating between levels around 10 to 12 even if someday it had traded below 9 also.
Moreover, during the monthly time frame, it displayed a kind of inverse Head and Shoulder pattern on the line chart, and in the weekly timeframe, it resembled a kind of double bottom pattern, indicating a potential upward movement from these levels. Furthermore, it successfully broke out from a downward-sloping trend line.
In the current month, it has surged around 20%. The last time it surged over 20% was in September 2021. Historically, during the COVID-19 pandemic, the VIX surged by 49% from similar lower levels, reaching a high of 86, obviously not immediately but over the following two months. Similarly, in September 2021, it increased by 26.75%, hitting a high of approximately 37 in February 2022 during the next 5 months.
Upon reviewing the technical chart of the India VIX, the projected next levels which might act as a hurdle appear to be within the range of 17.5 to 18 levels. Historically, this level has been tested multiple times. If the VIX does not retrace back to lower levels, there’s a possibility it might surpass this resistance and ascend to the subsequent barrier around 28 to 30 levels.
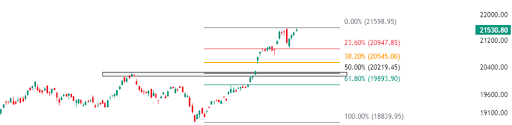
As we are aware, the market has reached its all-time high levels; today, Nifty touched its all-time high of 21,603 but subsequently experienced a steep fall from that point. This suggests that climbing higher from this level might not be easy, especially considering the rising VIX indicating increased risk.
Consequently, the question arises: where could the index find support after touching its all-time high levels? To answer this, a simple application of the Fibonacci tool, drawn from the current rally from bottom to top, indicates the next potential support is around 20,950. Notably, on December 21, it already found support around this level but dipped to a low of 20,976.
Beyond this point, other support levels could be identified at 20,500, a level with psychological significance, and 20,200, which marks the last swing high and coincides with the 50% level of the current trend. It’s crucial to note that these levels are predictions and not suggestions.
The Volatility Index serves as a gauge of the market’s anticipation of volatility in the short term. Typically, during periods of market turbulence, significant upward or downward movements occur, leading to an increase in the volatility index. Conversely, as volatility diminishes, the volatility index decreases. It’s important to note that the Volatility Index differs from a price index like NIFTY. While a price index is calculated based on the price shifts of the underlying stocks, the Volatility Index is derived from the order book of the underlying index options, denoted as an annualized percentage.
Disclaimer: This blog has been written exclusively for educational purposes. The securities mentioned are only examples and not recommendations. It is based on several secondary sources on the internet and is subject to changes. Please consult an expert before making related decisions.
Published on: Dec 27, 2023, 3:54 PM IST
We're Live on WhatsApp! Join our channel for market insights & updates

Get the link to download the App

