
Indian Energy Exchange Ltd. (IEX), a leading power market operator in India, lately shown an enthralling increase in its price movements, piqued the curiosity of traders and investors across the board. When we look at current market mood, we see a mix of bullish and neutral signs, offering a nuanced picture for the near future.
Let’s navigate through the technical tapestry of IEX, analyzing key indicators and trends to decipher the potential pathways that this dynamic stock might embark upon.
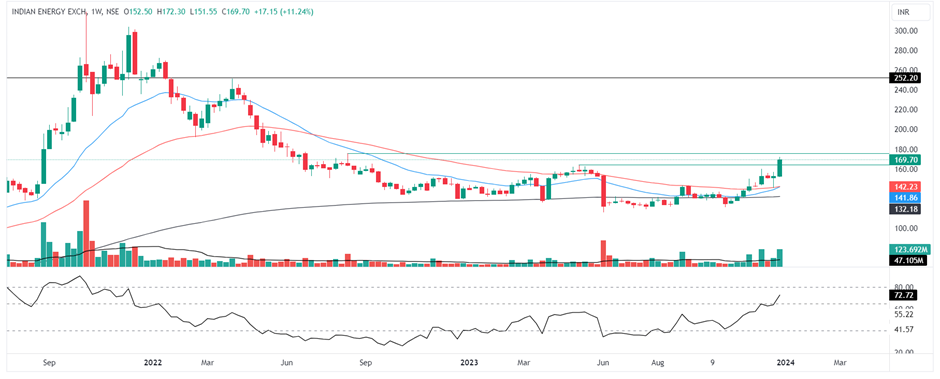
Weekly chart of IEX Ltd.
The weekly chart of IEX Ltd indicates a favorable buying opportunity, with the stock currently trading at Rs 170, surpassing its previous 52-week high. A strong support level is observed in the range of Rs 115 to Rs 120, mitigating the likelihood of abrupt downward movements. A modest resistance is present just above the current level at Rs 176, with a more substantial target at Rs 252.
Having declined from Rs 300 in 2021, the stock found support at the 200-day EMA towards the end of 2022, exhibiting consolidation throughout 2023. The recent breakout of the 52-week high, accompanied by robust weekly bullish candle formation, signals the initiation of a bullish uptrend. Increased trading volumes, surpassing averages, further validate the positive momentum.
The stock is trading above crucial moving averages, with the 20-day EMA crossing above the 50-day EMA towards the week’s conclusion, indicating a bullish trend. Additionally, the stock respected the 200-day long-term moving average, reinforcing the upward trajectory.
Technical indicators corroborate the upward potential, as the Relative Strength Index (RSI) ascends from the oversold zone to the bullish range of 65-80. The stock’s relative strength against the Nifty 50 is poised to turn positive, with the ADX indicator at a level of 35 on the daily chart, suggesting robust directional strength.
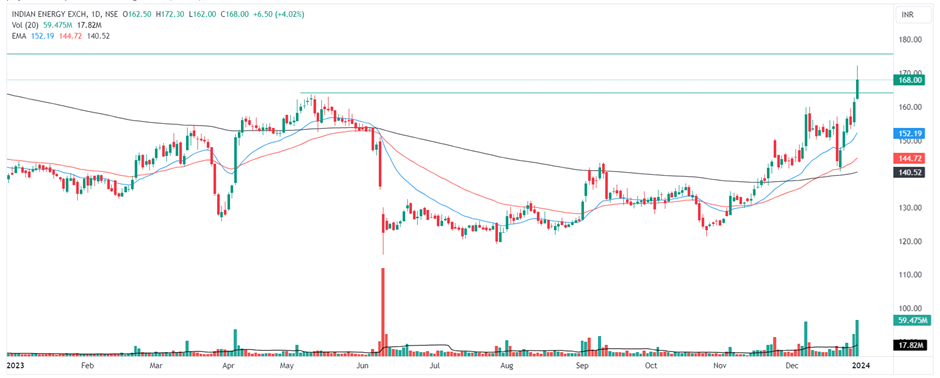
Daily chart of IEX Ltd
Examining the daily chart, a golden cross, signaling bullish momentum, occurred a few days ago, and the stock price has since reflected this positive development. Volumes have experienced an uptick, indicating increasing market participation. Despite the favorable outlook, attention is warranted at the Rs 176 resistance level, which may impede further upward movements.
The technical analysis of IEX Ltd, both on a weekly and daily basis, suggests a bullish sentiment, supported by various indicators and chart patterns. Traders and investors may find the current levels conducive to entering long positions, keeping a watchful eye on key resistance levels for potential price reactions.
Disclaimer: This blog has been written exclusively for educational purposes. The securities mentioned are only examples and not recommendations. The information is based on various secondary sources on the internet and is subject to change. Please consult with a financial expert before making investment decisions.
Published on: Dec 29, 2023, 1:41 PM IST
We're Live on WhatsApp! Join our channel for market insights & updates

Get the link to download the App

