
IRCTC may become a strong positive breakout candidate in the coming time. The stock price is currently trading at Rs 746 and has witnessed the formation of a rectangle chart pattern. The RSI, ADX and other parameters of technical analysis are in sync with the breakout.
The rectangle chart pattern is a technical analysis tool used by traders to identify potential trading opportunities. It forms when the price of an asset consolidates within a defined range bounded by parallel lines of support and resistance. This consolidation period represents a pause in the prevailing trend, often indicating indecision among buyers and sellers.
Two horizontal lines, one for support and one for resistance, define the rectangle’s upper and lower boundaries. The price oscillates between these lines, creating a sideways trading range. Rectangles can last for weeks or even months, depending on the market and the asset being traded. Volatility within the rectangle tends to be lower than during trending periods.
Traders use rectangle patterns to identify potential breakout opportunities. A breakout occurs when the price breaks decisively above the resistance line in a bullish rectangle or below the support line in a bearish rectangle. This breakout typically signals the resumption of the previous trend, offering opportunities for long or short trades, respectively.
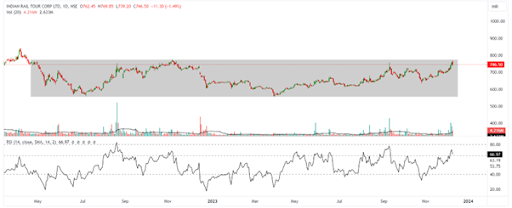
1-day chart of IRCTC
IRCTC’s stock trading with bearish day candle day progresses to complete a chart pattern called a rectangle chart pattern.
The stock witnessed a gap-up opening at Rs 762, jumped to its day high of Rs 769, and touched an intraday low of Rs 339. The stock has been in a strong uptrend for the last 34 weeks.
IRCTC has formed a rectangle chart pattern waiting for a breakout or reversal, which is a turning point for the stock price to be bullish or bearish. The stock price may touch its upper resistance and consolidate within the range of Rs 735 and Rs 775 to accumulate some volume, then breakout strong as shown on the chart. Once the upper resistance breaks out, the stock will trade at its 52-week high with high momentum, as the railway stocks are already in talks.
The relative strength index also entered the 65–80 range with zigzags, suggesting the stock price may grab the volatility in the coming time. The ADX indicator line is also above the 25 level, showing the good strength of the price.
During any corrective moves, the major support level to watch for is Rs 735. The overall structure remains favourable for traders, as the stock continues to trade above all its important moving averages, indicating a sustained upward trend.
The stock has given substantial returns of 381.07% over a decade.
Indian Railway Catering & Tourism Corp. Ltd. provides railway-related services. It engages in catering and hospitality, internet ticketing, travel and tourism, and rail plant business.
Disclaimer: This blog has been written exclusively for educational purposes. The securities mentioned are only examples and not recommendations. The information is based on various secondary sources on the internet and is subject to change. Please consult with a financial expert before making investment decisions.
Published on: Dec 8, 2023, 4:01 PM IST
We're Live on WhatsApp! Join our channel for market insights & updates

Get the link to download the App

