
Asian Paints is losing its shine, with its stock trading 17% below its all-time high. The chemical industry giant, which manufactures and markets paint and coating products, has seen a decline in share performance since reporting its Q2 FY24 results. Here’s an update on its recent financial performance and outlook:
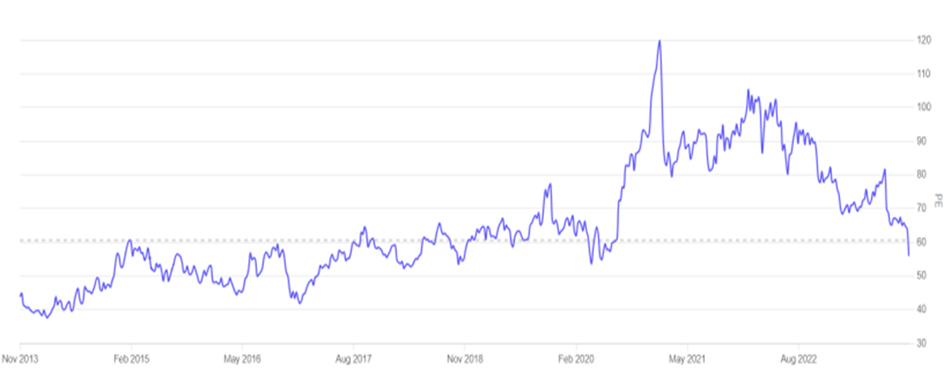
The stock is currently trading just below the Rs. 3000 marks, and its 10-year median PE stands at 60.60. The current PE falls below this level on October 26, 2023. While the PE is already trading below the 1-year, 3-year, and 5-year median PE, it is still relatively high when compared to the PE multiples of peers, indicating that the stock remains expensive.
Management Outlook for Sales Performance:
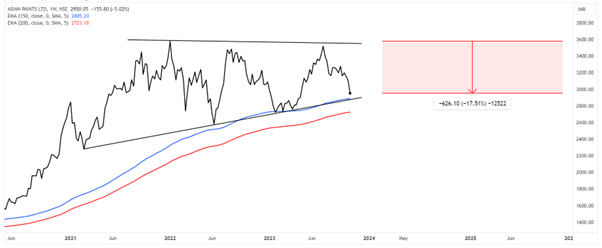
The stock’s price chart shows that it is forming an ascending triangle-like chart pattern. The stock price is down by 17% from its all-time high around Rs. 3600, acting as a resistance level. The trendline below is acting as a support level, coinciding with the 150-day Exponential Moving Average (DEMA). Currently, the share price is trading above the 200-day EMA, which is a positive sign. With the stock price trading near the support trendline, there is a high likelihood of a bounce from the Rs. 2900 level. In the worst-case scenario, the price may fall below the 200 DEMA. A bounce back is expected, possibly following an ascending triangle breakout as it approaches all-time high levels, particularly during the festive and marriage season.
Disclaimer: This blog has been written exclusively for educational purposes. The securities mentioned are only examples and not recommendations. It is based on several secondary sources on the internet and is subject to changes. Please consult an expert before making related decisions.
Published on: Oct 27, 2023, 2:26 PM IST
We're Live on WhatsApp! Join our channel for market insights & updates

Get the link to download the App

