
JK Lakshmi Cement Ltd is a strong positive breakout candidate for today. The stock price is currently trading at Rs 876 and has witnessed a very clean break-out of the rounding bottom chart pattern. The RSI, ADX and other parameters of technical analysis are in sync with the breakout.
A rounding bottom chart pattern is a bullish reversal pattern that indicates the end of a downtrend and the beginning of an uptrend. It is characterized by a gradual and rounded curvature at the bottom of a price decline, resembling the shape of a bowl or saucer.
The first stage of the pattern is a sharp decline in price, followed by a period of consolidation. During the consolidation period, the price may move up and down, but it will generally trend sideways. The final stage of the pattern is a breakout, which occurs when the price breaks above the resistance line.
The rounding bottom pattern is considered to be a reliable indicator of a bullish trend reversal. The success rate of the pattern is estimated to be around 70%. However, it is important to note that the pattern is not a guarantee of future price movements. Traders should always use other technical indicators and fundamental analysis to confirm their trading decisions.
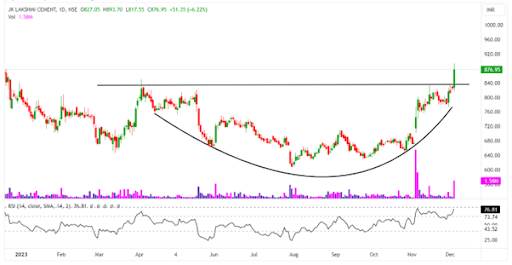
1-day chart of JK Lakshmi Cement Ltd
JK Lakshmi Cement’s stock closed with a bullish candle as the day progressed to hit a 52 week-high of Rs 893.70 with Indian markets trading at an all-time high.
The stock witnessed a small gap-up opening at Rs 827, jumped to its 52-week high of Rs 893, and touched an intraday low of Rs 817. The stock is in a strong uptrend on a daily basis.
JK Lakshmi Cement has formed a rounding bottom chart pattern with breakout as well as a 52 weeks high breakout, which is a positive sign. The stock price broke its upper resistance of Rs 840 and traded high with sustenance; the volume was more than the daily average. The volume chart also frames a feasible pattern for breakout as it decreases over time and gradually increases as a breakout nears.
The relative strength index also entered the 65–80 range, suggesting bullish momentum for stocks. The ADX indicator line is also at 55, showing the tremendous strength of the price.
During any corrective moves, the major support level to watch for is Rs 840. The overall structure remains favourable for traders, as the stock continues to trade above all its important moving averages, indicating a sustained upward trend.
The stock has given substantial returns of 1,452.00% over a decade.
JK Lakshmi Cement Ltd. engages in the manufacture and market of cement. Its products include JK Lakshmi-plast Pro+ Cement, PPC blended cement, ordinary portland cement, power mix concrete, autoclaved aerated concrete blocks, and light weight gypsum plaster.
Disclaimer: This blog has been written exclusively for educational purposes. The securities mentioned are only examples and not recommendations. The information is based on various secondary sources on the internet and is subject to change. Please consult with a financial expert before making investment decisions.
Published on: Dec 5, 2023, 5:31 PM IST
We're Live on WhatsApp! Join our channel for market insights & updates

Get the link to download the App

