
Amidst a sharp decline in the Nifty, plummeting over 500 points from it’s all-time high on September 15, some stocks are showing resilience and poised for a breakout. One such stock demonstrating a robust technical structure is JK Tyre & Industries.
JK Tyre & Industries, a prominent player in the Indian and global tyre manufacturing arena, is among the world’s top 25 manufacturers. Pioneering radial technology with the production of the first radial tyre in 1977, it now reigns as the market leader in the Truck Bus Radial segment. With innovations like ‘Smart Tyre’ technology and Tyre Pressure Monitoring Systems (TPMS), the company has a strong presence in 105 countries, supported by over 180 global distributors. Boasting 12 ‘sustainable’ manufacturing facilities across India and Mexico, JK Tyre produces approximately 35 million tyres annually, backed by a network of 4,000 dealers and 500 dedicated Brand stores.
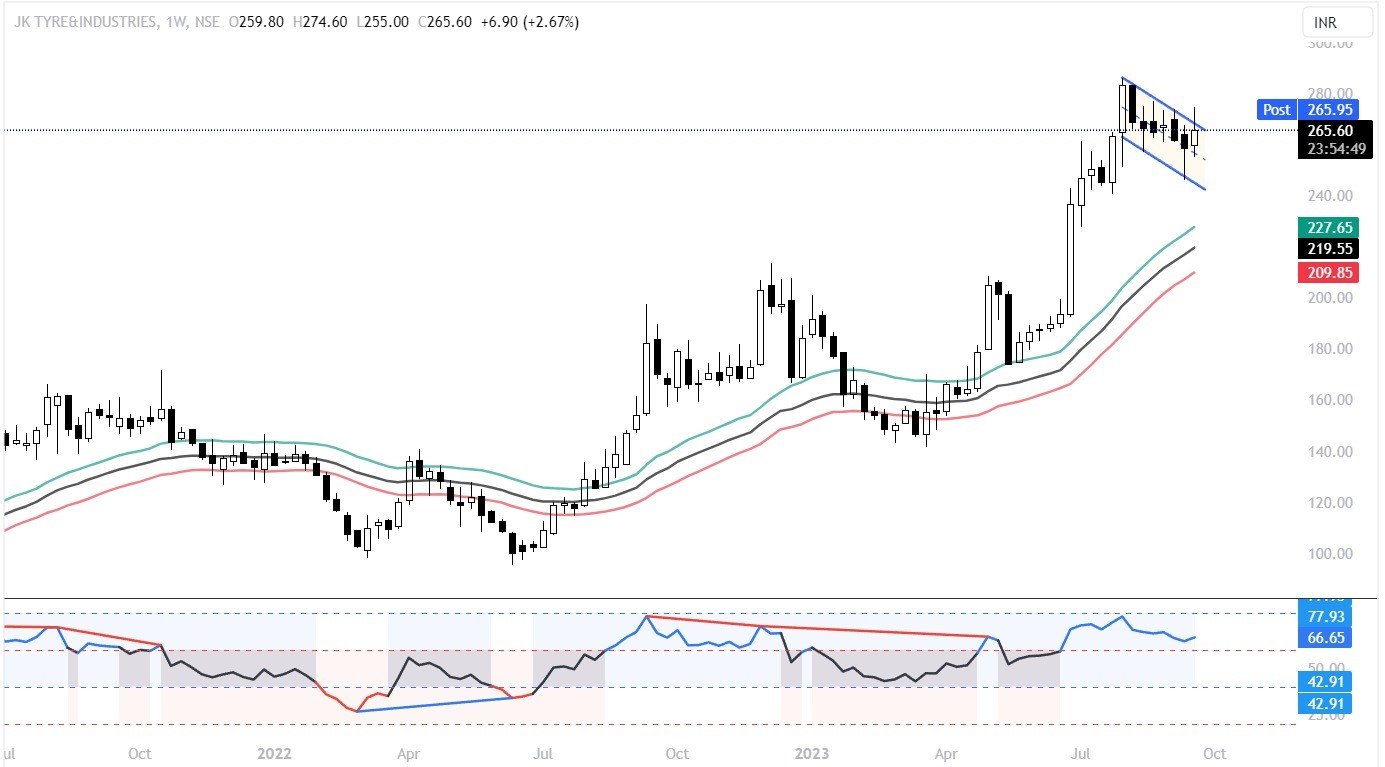
JK Tyre & Industries has carved out a flat base over the past seven weeks, positioning itself just 5% below the pivot and it’s all-time high. This formation resembles a bullish flag pattern, signaling an impending breakout. The stock currently trades above all long-term moving averages and it is comfortably placed 2.73% above the 50 DMA. Key technical indicators paint a bullish picture – the Daily MACD is on the verge of a bullish signal, the weekly RSI resides in a strong bullish zone, and its price relative strength line surpasses 82% of listed companies. The Mansfield relative strength indicator stands firmly at 2.48, indicating strong bullish sentiment. Furthermore, the weekly Elder’s impulse system appears neutral, while the KST and TSI indicators are in bullish alignment. With its trading position above the monthly VWAP, the stock appears poised for a bullish pattern breakout. Anticipate a surge in momentum above the Rs 269-272 zone, with support firmly rooted at the Rs 253 level.
Disclaimer: This blog has been written exclusively for educational purposes. The securities mentioned are only examples and not recommendations. It is based on several secondary sources on the internet, and is subject to changes. Please consult an expert before making related decisions.
Published on: Sep 21, 2023, 5:42 PM IST
We're Live on WhatsApp! Join our channel for market insights & updates

Get the link to download the App

