
Established in 1988, Kaynes Technology (KTIL) started operations in 2008. It manufactures printed circuit boards, and other electronic assemblies, having application in aerospace, defence, railways, automotive, information technology, peripheral, industrial and medical electronics.
Shares of Kaynes Technology surged 9.6%, its highest single-day move in nearly 4-months. The stock has formed a fresh two-week high after this up-move.
Kaynes Technology has exhibited a significant technical breakout from a double bottom pattern on the daily chart, marked by a strong move above the neckline resistance around the Rs 5,050 level. The double bottom pattern, a bullish reversal formation, confirming buying interest at lower levels.
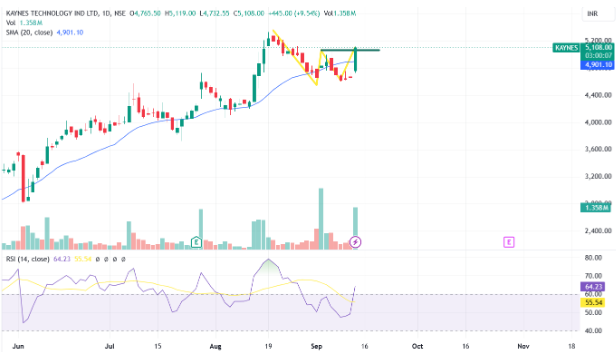
The breakout above the neckline of the double bottom pattern occurred in the Kaynes Technology with a solid bullish candlestick, indicating strong buying momentum. The breakout candle is accompanied by increased trading volume, further validating the breakout strength and confirming the pattern.
The stock is trading above the 20-day Simple Moving Average (SMA), which is currently positioned around Rs 4,901. This moving average has acted as a dynamic support level, providing additional confirmation of the upward momentum.
The volume surge observed during the breakout phase suggests strong participation from market participants, reinforcing the reliability of this breakout. This surge is a positive sign, indicating that the breakout is not merely a false move but is supported by substantial buying interest.
The Relative Strength Index (RSI) is trending upwards and currently stands at 64.23. The daily 14 periods RSI has generated a buy signal moving above its nine periods average thus validates positive bias
The breakout from the double bottom neckline is a strong bullish signal for Kaynes Technology, indicating a potential upward trajectory. Traders should look for sustained volume and price action above the neckline to maintain bullish bias, while the 20-day SMA and RSI will be key indicators to monitor for any reversal or consolidation signals.
Disclaimer: This blog has been written exclusively for educational purposes. The securities mentioned are only examples and not recommendations. It is based on several secondary sources on the internet and is subject to changes. Please consult an expert before making related decisions.
Published on: Sep 12, 2024, 3:33 PM IST
We're Live on WhatsApp! Join our channel for market insights & updates

Get the link to download the App

