
The Indian stock market is witnessing a record-breaking rally, with all major indices soaring to new heights and presenting impressive gains for investors. Over the past year, there has been a remarkable surge in mid-cap and small-cap stocks, with micro-cap stocks emerging as the clear frontrunners, boasting an astonishing 84.90% surge – the highest return among broader indices.
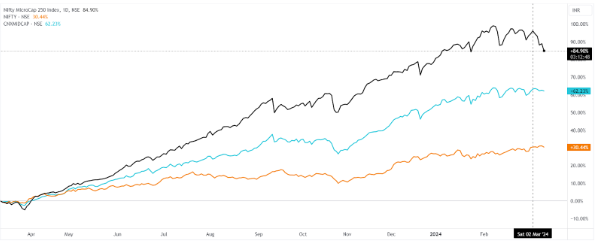
Nifty 50 (representing large-cap stocks), Nifty Mid-cap 150, and Nifty Micro-cap 250. All three have delivered substantial returns, ranging within 30%. The Nifty 50, representing established blue-chip companies, has provided a solid 30.44% return. The Nifty Mid-cap 150, showcasing mid-sized companies with high growth potential, has nearly doubled the return of large-caps with an impressive 62.23%.
However, the real standout performer is the Nifty Micro-cap 250. This index, which tracks the performance of the 250 smallest companies listed on the National Stock Exchange (NSE), has delivered a phenomenal 84.90% return over the past year. In fact, on March 2nd, 2024, the Nifty Micro-cap 250 reached a peak of 96.18% – an astonishing three times the return of the Nifty 50!
This surge in micro-cap stocks underscores a robust appetite for high-growth potential companies among investors. While these smaller companies offer significant upside, they also entail a higher degree of risk. Investors contemplating entry into the micro-cap space should conduct thorough research and exercise caution due to the inherent volatility associated with these stocks.
This surge in micro-cap stocks indicates a strong appetite for high-growth potential companies among investors. While these smaller companies can offer significant upside, they also carry a higher degree of risk. Investors considering venturing into the micro-cap space should conduct thorough research and exercise caution due to the inherent volatility of these stocks.
| Index | Historical Returns in % | |||||
| 1 Month | 3 Months | 1 Year | 3 Years | 5 Years | 10 Years | |
| NIFTY MICROCAP250 | -5.03 | 9.31 | 86.03 | 43.14 | 30.24 | 28.55 |
| NIFTY SMALLCAP 50 | -5.64 | 7.11 | 71.37 | 21 | 19.71 | 15.44 |
| NIFTY SMALLCAP 100 | -5.1 | 8.02 | 67.44 | 24.43 | 21 | 17.67 |
| Nifty smallcap 250 | -3.74 | 9.09 | 62.25 | 28.65 | 24.18 | 20.54 |
| Nifty Midcap 50 | 0.23 | 10.58 | 61.97 | 27.39 | 25.01 | 21.13 |
| NIFTY MIDCAP 100 | -0.69 | 10.18 | 59.21 | 27.81 | 24.1 | 20.89 |
| Nifty Next 50 | 5.21 | 18.61 | 58.46 | 20.6 | 18.12 | 18.21 |
| NIFTY MID SELECT | 0.45 | 9.37 | 57.84 | 21.27 | 20.87 | 21.93 |
| Nifty Midcap 150 | -1.06 | 9.33 | 54.98 | 26.54 | 24.81 | 22.61 |
| NIFTY TOTAL MKT | 1.47 | 9.41 | 39.84 | 19.48 | 18.81 | 16.68 |
| Nifty 500 | 1.73 | 9.42 | 38.65 | 18.93 | 18.52 | 16.33 |
| Nifty 200 | 2.51 | 9.59 | 36.48 | 17.98 | 17.75 | 15.76 |
| Nifty 100 | 3.12 | 9.48 | 32.99 | 16.46 | 16.74 | 15.08 |
| Nifty 50 | 2.69 | 7.81 | 28.45 | 15.98 | 16.62 | 14.56 |
| NIFTY MIDSMALLCAP 400 | -2.02 | 9.24 | – | – | – | – |
| NIFTY LargeMidcap 250 | 0.99 | 9.4 | – | – | – | – |
| NIFTY500 MULTICAP 50:25:25 | 0.27 | 9.34 | – | – | – | – |
Disclaimer: This blog has been written exclusively for educational purposes. The securities mentioned are only examples and not recommendations. The information is based on various secondary sources on the internet and is subject to change. Please consult with a financial expert before making investment decisions.
Published on: Mar 11, 2024, 2:12 PM IST
We're Live on WhatsApp! Join our channel for market insights & updates

Get the link to download the App

