
The Nifty 50, a robust index comprising 50 diversified stocks, serves as a key indicator of India’s economic landscape. Originating from the close of prices on November 3, 1995, it has grown to become a benchmark for investors, reflecting pivotal sectors. With a base value of 1000 and a base capital of Rs2.06 trillion, the Nifty 50 has consistently represented approximately 59% of the free float market capitalization of NSE-listed stocks as of September 29, 2023. Since June 26, 2009, the index has been computed using the Free Float Market Capitalisation weighted method, reflecting the dynamic nature of the market.
The journey of the Nifty 50 is characterized by significant milestones, each marked by distinct trading sessions. From a modest 333 sessions to reaching the 0-1,000 range, the index’s climb has been both gradual and meteoric. Noteworthy is the 1,000-2,000 range, which required 2,819 sessions, showcasing increased momentum in its upward trajectory. The subsequent ranges, with varying sessions, demonstrate the resilience and adaptability of the index in response to market dynamics.
| Nifty Range | Trading sessions |
| 0-1,000 | 333 |
| 1,000-2,000 | 2,819 |
| 2,000-3,000 | 513 |
| 3,000-4,000 | 209 |
| 4,000-5,000 | 205 |
| 5,000-6,000 | 23 |
| 6,000-7,000 | 1,608 |
| 7,000-8,000 | 77 |
| 8,000-9,000 | 122 |
| 9,000-10,000 | 592 |
| 10,000-11,000 | 124 |
| 11,000-12,000 | 326 |
| 12,000-13,000 | 375 |
| 13,000-14,000 | 25 |
| 14,000-15,000 | 25 |
| 15,000-16,000 | 120 |
| 16,000-17,000 | 19 |
| 17,000-18,000 | 28 |
| 18,000-19000 | 425 |
| 19,000-20,000 | 51 |
| 20,000-21,000 | 60 |
As evident from the table, the initial ascent was relatively gradual, with the first 1,000 points taking 333 trading sessions. However, the pace picked up significantly thereafter, with several thousand-point milestones being crossed within shorter timeframes. The period between 6,000 and 7,000 points stand out, requiring 1,608 trading sessions, marking a period of consolidation.
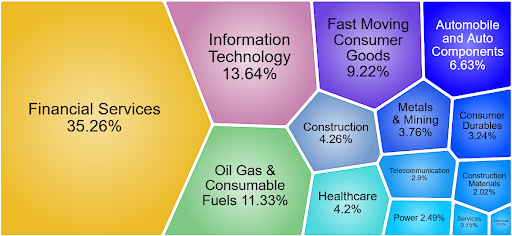
Adding depth to its significance, the Nifty 50 boasts a sectoral distribution that reflects the diverse sectors contributing to the index. The image below will serve as a visual representation of the market’s composition and the index’s role in capturing this diversity.
In conclusion, the Nifty 50 has not only witnessed significant levels and trading sessions but has also become an integral part of investors’ portfolios. Its ability to adapt to various market conditions and represent diverse sectors reinforces its position as a reliable barometer of India’s economic health. As we continue to traverse the peaks and valleys of the financial landscape, the Nifty 50 remains a beacon, guiding investors through the ever-evolving world of the Indian stock market.
Disclaimer: This blog has been written exclusively for educational purposes. The securities mentioned are only examples and not recommendations. It is based on several secondary sources on the internet and is subject to changes. Please consult an expert before making related decisions.
Published on: Dec 8, 2023, 6:01 PM IST
We're Live on WhatsApp! Join our channel for market insights & updates

Get the link to download the App

