
Understanding the relationship between large-cap and small-cap stocks in India can be crucial for investors. The Nifty 50 and Nifty Smallcap 100 indices offer valuable insights into this dynamic. This article explores the concept of the gap between these two indices, its historical fluctuations, and potential implications for the Indian stock market.
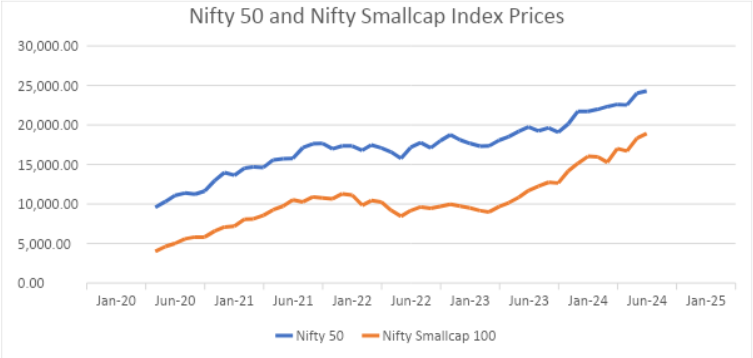
To assess the relative performance of Nifty 50 and Nifty Smallcap 100, we calculate the gap between them. This involves finding the difference between the indices’ values for a specific period. For instance, in July 2024, the Nifty 50 stood at 24,296.45, while the Nifty Smallcap 100 was at 18,928.40. Subtracting the smaller value from the larger one results in a numerical gap of 5,368.05.
To express this gap as a percentage, we can take it a step further. We add the values of both indices (24,296.45 + 18,928.40 = 43,224.85) to relate gap number with both the indexes for understanding relative performance and divide the gap by this combined total. In this case, the gap between Nifty 50 and Nifty Smallcap 100 for July 2024 was 12.42%.
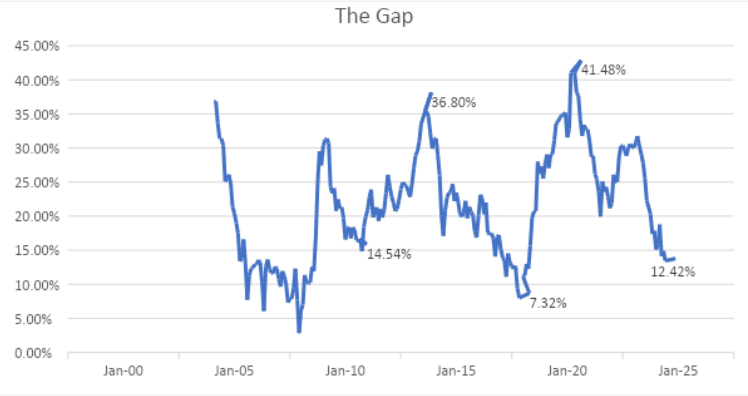
The gap between Nifty 50 and Nifty Smallcap 100 has exhibited significant variations over time . Let’s explore some noteworthy periods:
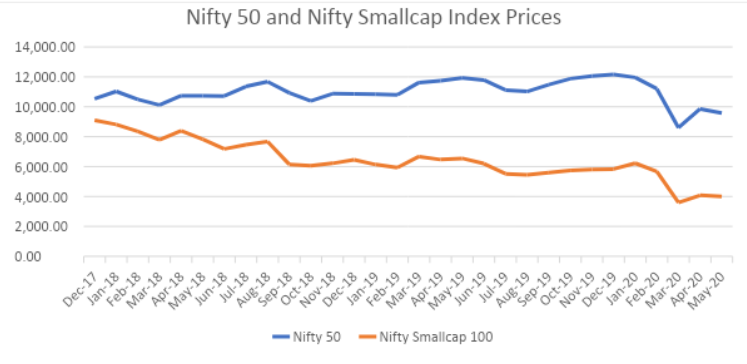
May 2020 to July 2024 (Present): Subsequently, from its peak in 2020, the gap declined sharply. Market conditions responded with a notable surge, reducing the gap from 41.8% in March 2020 to a new low of 12.42% by July 2024.
The analysis of the historical data suggests that the gap between Nifty 50 and Nifty Smallcap 100 might function as a mean reverting number. This implies that after periods of significant widening or narrowing, the gap tends to move back towards its historical average.
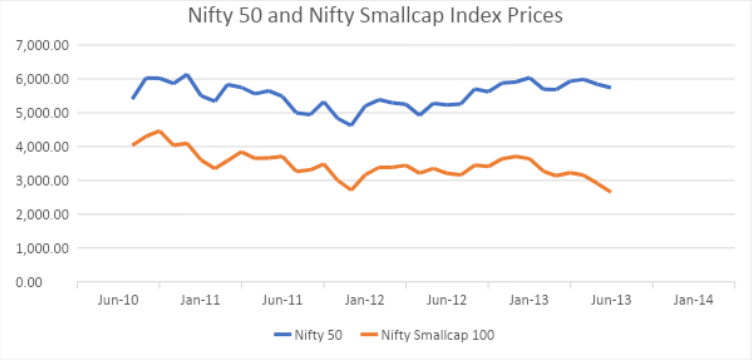
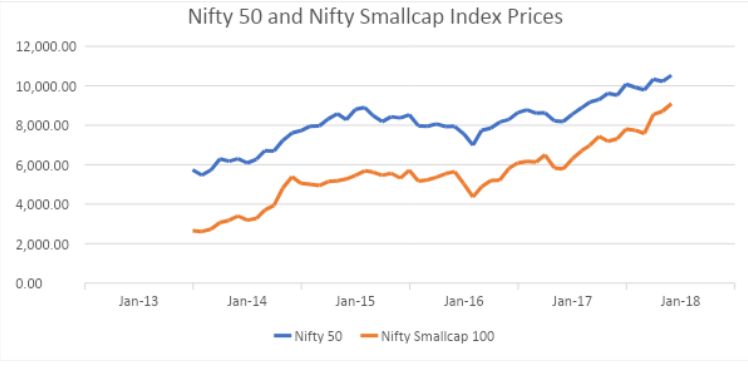
For example, the substantial widening observed between 2010 and 2013 was followed by a period of narrowing until 2017. Since then, it has begun to widen again. This pattern suggests that the gap might continue to narrow in the coming years, potentially reaching a bottom in 2024 before reverting to its historical average and eventually surpassing it.
If the gap truly exhibits mean reversion, a narrowing gap could signal that the stock market is approaching a peak and might enter a consolidation phase. This consolidation zone could be characterized by periods of up and down movements within a longer-term sideways trend. Investors should be mindful of this possibility and adapt their investment strategies accordingly.
Disclaimer: This blog has been written exclusively for educational purposes. The securities mentioned are only examples and not recommendations. The information is based on various secondary sources on the internet and is subject to change. Please consult with a financial expert before making investment decisions.
Published on: Jul 8, 2024, 6:14 PM IST
We're Live on WhatsApp! Join our channel for market insights & updates

Get the link to download the App

