
In the context of a broader market recovery, the Nifty decisively opened and closed above the 50 DMA. However, recent times have seen lower volume, and the daily trading range has shrunk to just 86.35 points. On Friday, it tested the 38.2% retracement level of the previous fall, aligning with our expectations from the past two days. On Friday, the hourly RSI entered the bullish zone, reaching the positive divergence target. The Bollinger Bands have remained horizontal for two consecutive days, and the daily RSI is at 50. The question now is how long this pullback will continue. Typically, pullbacks end at the 38.2% retracement level, or at most, at the 50% retracement level. As the first level of the pullback is completed, the 50% retracement level and the 20 DMA are at the same level, at 19,766, which is just another 113 points away. Monday’s closing will provide a clue regarding the continuation of the pullback or the confirmation of a reversal. In any case, if the Nifty closes below the 50 DMA again, it implies that we are heading for a major low below 19,223. On the upside, the hurdle is positioned in the zone of 19,778-19,882. In other words, the 19,223-19,778 zone is crucial for the market. Most likely, the Nifty will consolidate within this zone for some time. Maintain a neutral bias.
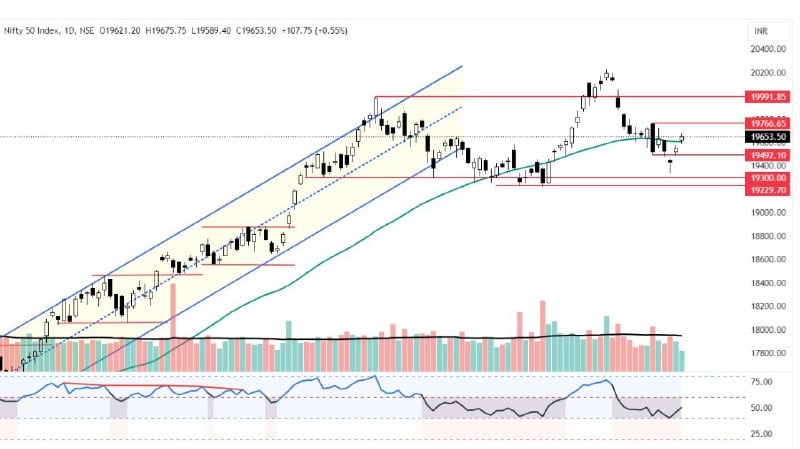
The Nifty traded narrowly after an initial positive opening. A move above 19,655 is positive, and it could test 19,710. Maintain a stop loss at Rs. 19,620. However, a move below 19,610 is negative and may lead to a test of 19,555. Maintain a stop loss at 19,650. Below 19,555, continue with a trailing stop loss.
On Friday, the Bank Nifty saw a 0.33% increase but closed below the opening level. It encountered resistance at the 8 EMA and the 23.6% retracement level. Recent times have seen very low volume and a small-bodied candle with wicks on either side, indicating indecision. On an hourly chart, it closed within the moving average ribbon, with both the 20 DMA and 50 DMAs in a downtrend. The weekly chart’s MACD indicates strong bearish momentum, and the RSI closed at the previous low. These indicators lack bullish strength. The daily upper Bollinger band remains flat. In any case, if the upper Bollinger band starts a downtrend, we expect the price to continue declining. On the upside, sustaining above the level of 44,500 is likely to be positive, and it could test the level of 44,761, which is the 50 DMA and immediate resistance. Conversely, a move below 44,360 is likely to have negative implications. Maintain a neutral to bearish bias.
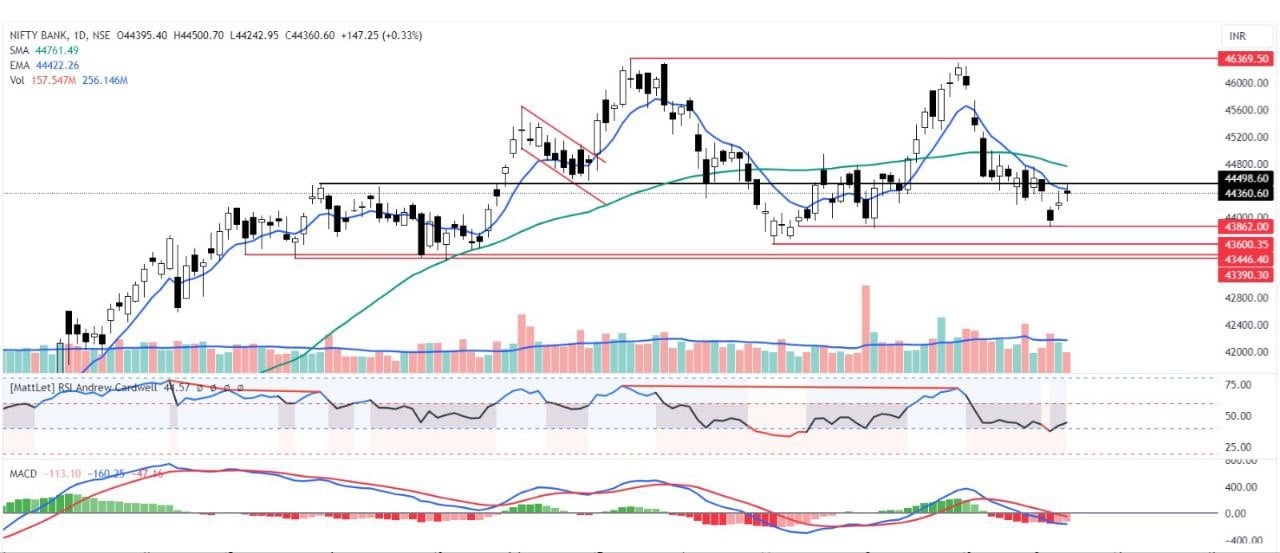
The Bank Nifty encountered resistance at the 23.6% retracement level and formed an indecisive candle. A move above 44,400 is positive, and it could test 44,570. Maintain a stop loss at 44,280. Conversely, a move below 44,280 is negative and may test 44,000. Maintain a stop loss at 44,400. Below 44,000, continue with a trailing stop loss. The risk-reward ratio is not favorable for long positions.
Disclaimer: This blog has been written exclusively for educational purposes. The securities mentioned are only examples and not recommendations. It is based on several secondary sources on the internet and is subject to changes. Please consult an expert before making related decisions.
Published on: Oct 9, 2023, 8:08 AM IST
We're Live on WhatsApp! Join our channel for market insights & updates

Get the link to download the App

