
The Nifty opened lower at 19539, below the 50 DMA. Subsequently, it attempted to recover in the initial hour of trading. Interestingly, it reached an intraday high of 19589, which also happened to be the low of the previous trading session. After testing the prior trading session low, it witnessed a sell-on-rise scenario as profit booking emerged. Nifty drifted lower but largely remained within the range of the first hour’s bar. Ultimately, Nifty closed down by 0.72% below the 19500 mark.
On the daily chart, Nifty formed a small-bodied bearish candle with a large upper shadow and a small lower shadow. Currently, Nifty is trading below its 20 and 50 DMAs, which is negative for the index. However, it’s heartening to see that, despite the chaotic situation, the bulls managed to defend the gap area of October 5. As long as the bulls can defend this gap area, a pullback rally is likely. Nevertheless, any pullback attempt would face resistance at the 50 DMA, which is situated at 19602. Sustaining above this level would lead to a further rally towards 19670 and 19720.
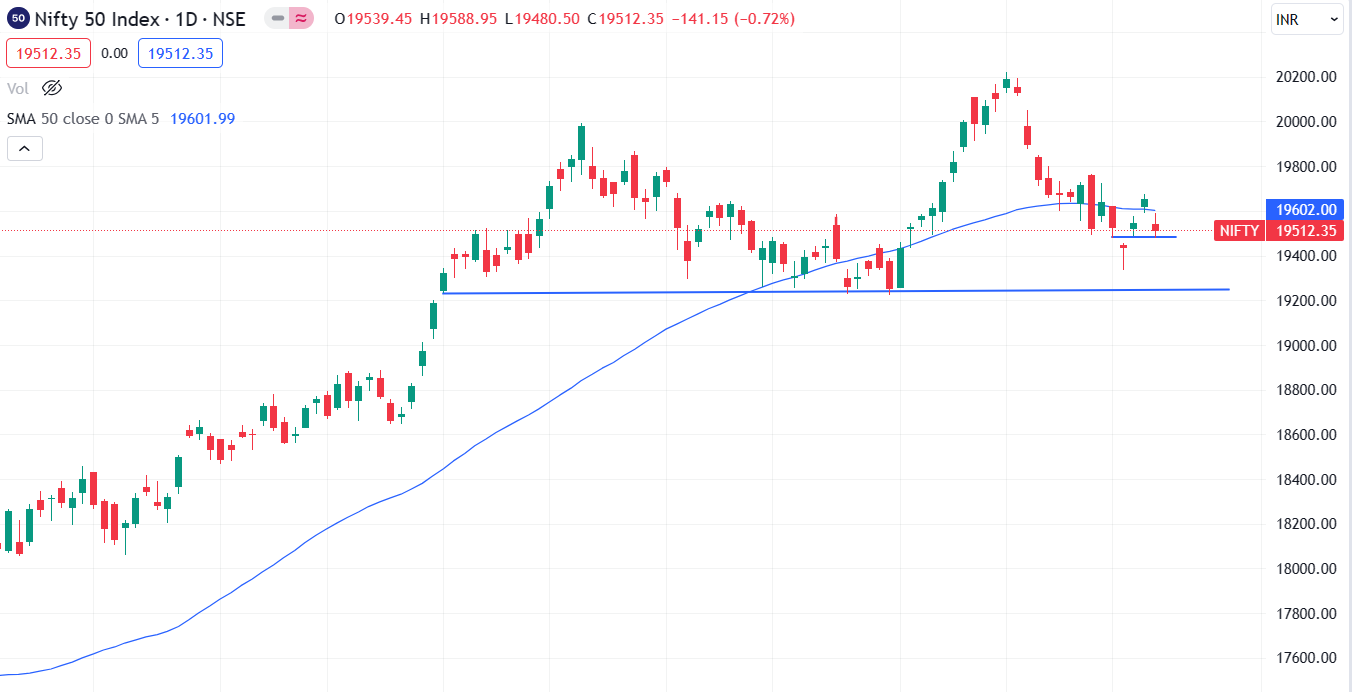
Nifty, after a gap-down opening, attempted to cross the level of 19600 but failed to do so, ending lower. Going forward, a move above the level of 19602 is positive, and it could test the level of 19670. Maintain a stop loss at the level of 19472. However, a move below the level of 19472 is negative and may lead to a test of 19400 followed by 19330. Maintain a stop loss at 19540.
Bank Nifty witnessed a sharp sell-off compared to Nifty, ending lower by over 1%. Additionally, it made a fresh swing low as it briefly breached the low of October 4. Bank Nifty opened at the level of 44057.80, and like Nifty, it also made a recovery attempt. However, selling pressure emerged at higher levels, interestingly at the point of October 05’s low.
After the first hour of a wide range, Bank Nifty traded within the range of the first hourly bar. Bank Nifty is trading below the 20 and 50 DMAs, both of which are inclined downward, signaling concerns for the bullish trend. Meanwhile, on the daily 14-period RSI, there is a formation of positive divergence. This positive divergence could come into play only if the RSI moves above the level of 45. Hence, caution is advised. Regarding the MACD histogram, it shows an increase in bearish momentum, the -DI line has marked a fresh swing high, and the ADX line is also rising, though it remains below the level of 25. ADX moving above the level of 25 would be a significant cautionary sign for the bulls.
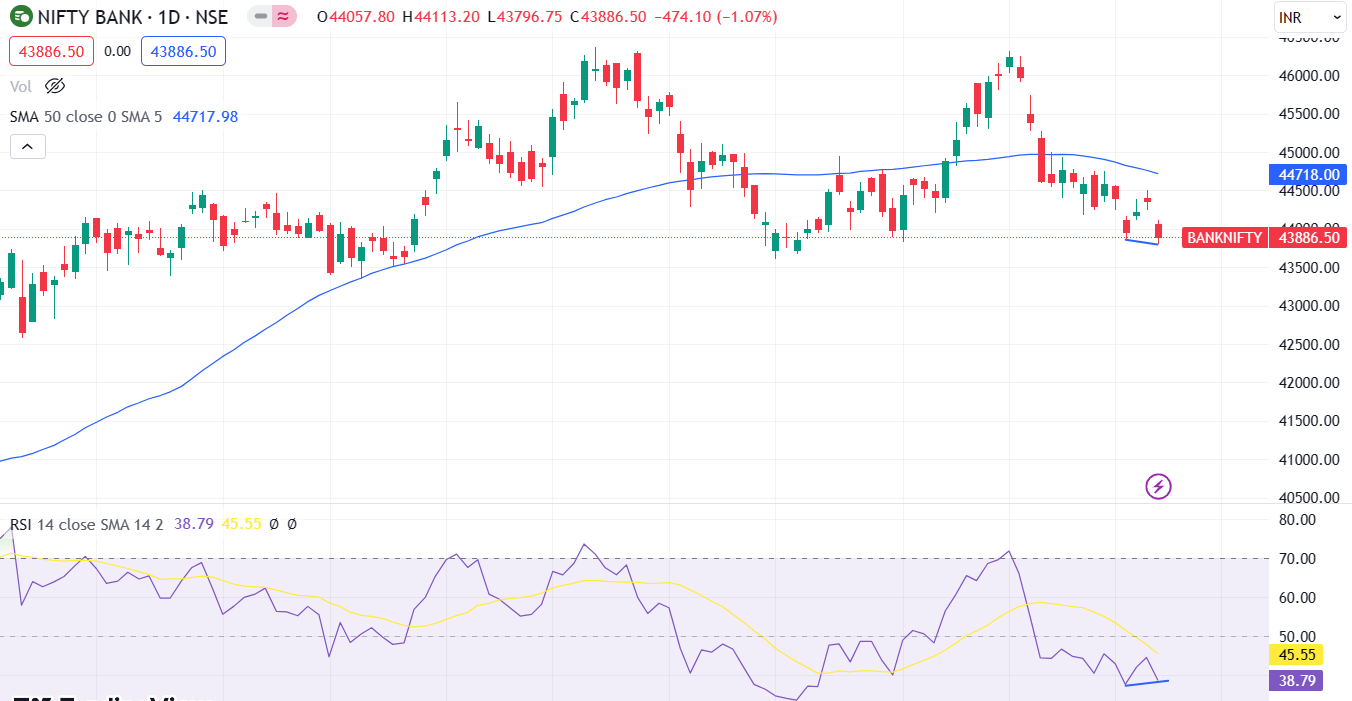
Bank Nifty marked a fresh swing low, but there is a formation of positive divergence on the RSI. Therefore, a move above the level of 43984 is positive, and it may attempt to test the level of 44200. However, a breach of 43790 would result in a test of 43600-43300 on the downside.
Disclaimer: This blog has been written exclusively for educational purposes. The securities mentioned are only examples and not recommendations. It is based on several secondary sources on the internet and is subject to changes. Please consult an expert before making related decisions.
Published on: Oct 10, 2023, 8:29 AM IST
We're Live on WhatsApp! Join our channel for market insights & updates

Get the link to download the App

