The Nifty tested the prior breakout level and bounced back sharply to close above the 19700 mark. It formed an outside bar. The index almost tested the high from this past Monday. The daily range has increased to 177 points. The index opened at the previous day’s low and closed above the prior day’s high. However, the volumes were not encouraging after this significant move. Despite the strong recovery from lower levels, the index is still below the 20 DMA. The Bollinger bands have contracted further. As mentioned earlier, the counter-trend consolidation will likely continue for some time. The monthly expiry is expected to be tricky. However, the probability of the index closing below Wednesday’s low of 19554 is very low. The RSI is still flat at the 50 zone. The MACD histogram indicates negative momentum. The Elder’s impulse system has formed another bearish bar, even after a big bar and positive closing. The India VIX has been surging higher for the last three days, indicating it is likely to increase further. The recent low range of 10.5 could potentially serve as a bottom for the India VIX. Open interest shows long built up. A day before the derivative expiry, the rollovers were at 51.59%. If these rollovers increase above 76%, it will indicate the continuation of the trend. As there is no clear trend visible, it is better to maintain a neutral bias. A close above the level of 19734 will provide a clear reversal and test the level of 19888 on the upside. However, if Nifty fails to do so, consolidation may continue for a longer period. Overall, the 19554-19734 range is likely to act as crucial support and resistance.
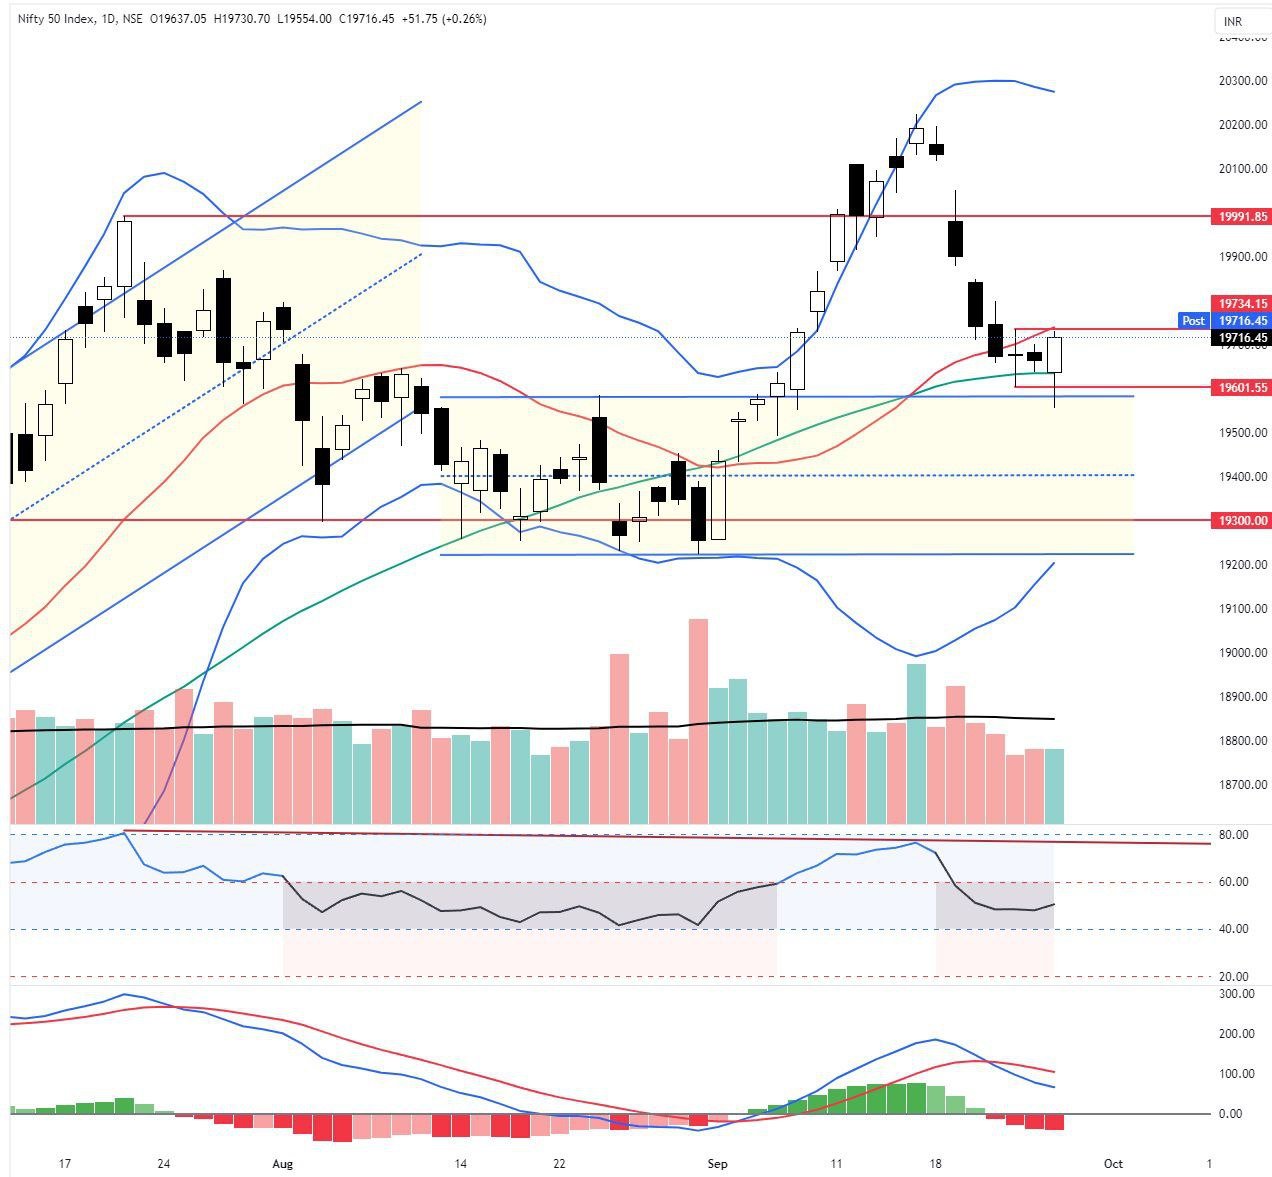
The Nifty bounced sharply from the opening lows. A move above the level of 19734 is positive, and it can test the level of 19805. Maintain a stop loss at the level of 19680. Above the level of 19805, continue with a trailing stop loss. However, a move below the level of 19680 is negative, and it can test 19620. Maintain a stop loss at the level of 19734.
The Bank Nifty has formed a hammer candle with higher volume, showing an early sign of reversal. Although it is still below the key moving averages and closed negatively, the price recovery suggests a possible turnaround. The Bollinger bands have flattened, indicating more consolidation ahead. Wednesday’s low of 44182 is the crucial support for now. Positive divergence in RSI still exists on the hourly chart. The MACD remains bearish. On an hourly chart, the index is above the 8 EMA. A close above Wednesday’s high of 44668 could lead to a smart recovery, and the index may test the 50 DMA of 44947.
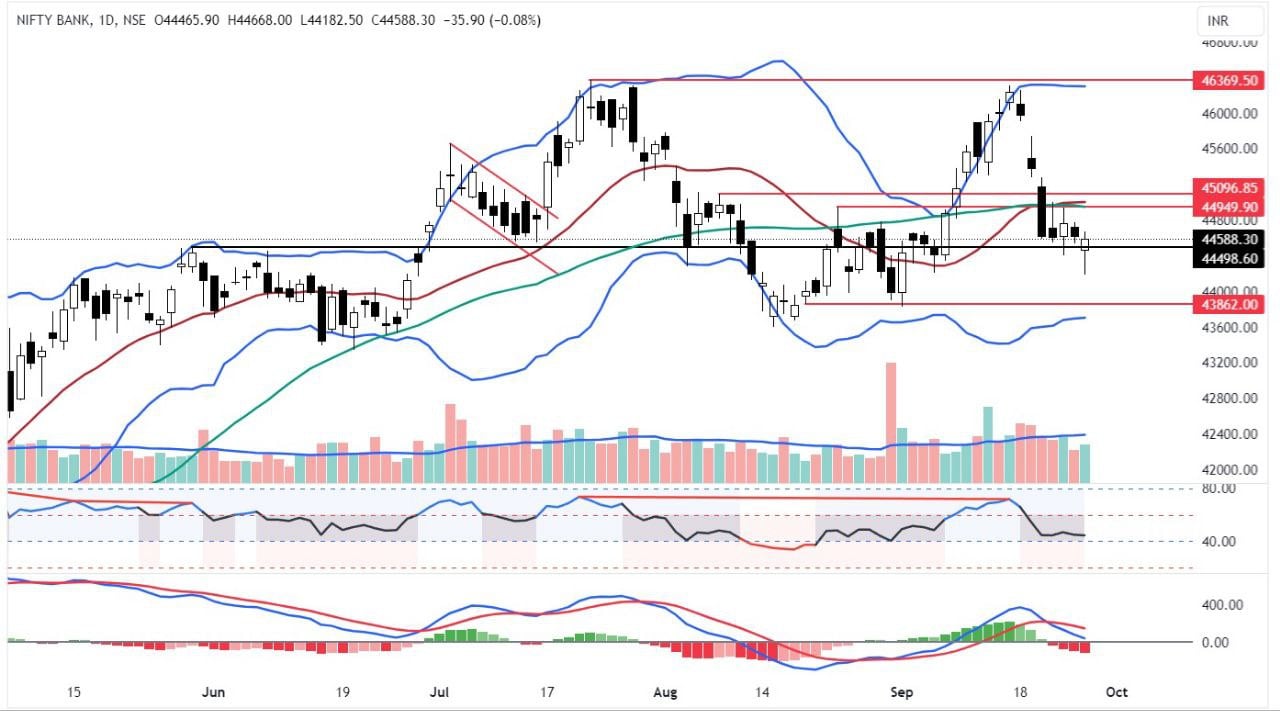
The Bank Nifty has formed a reversal candle, indicating a positive bias. A move above the level of 44634 is positive, and it can test the level of 44836. Maintain a stop loss at the level of 44545. However, a move below the level of 44545 is negative, and it can test the level of 44330. Maintain a stop loss at the level of 44635. Below 44330, continue with a trailing stop loss.
Disclaimer: This blog has been written exclusively for educational purposes. The securities mentioned are only examples and not recommendations. It is based on several secondary sources on the internet and is subject to changes. Please consult an expert before making related decisions.
Published on: Sep 28, 2023, 8:41 AM IST
We're Live on WhatsApp! Join our channel for market insights & updates

Get the link to download the App

