
On the weekly expiry, the NSE benchmark Nifty50 index opened the session on a positive note. However, soon after opening, a minor kneejerk reaction was seen in the Nifty50 index. After the initial volatility, the index inched higher to reclaim the important level of 23,600. However, the absence of buying interest at higher levels led to the trimming of gains, and Nifty50 settled with minuscule gains of 0.22% or 51 points.
On the daily chart, the Nifty has formed a candle resembling a doji pattern, placed beside the sizable bearish candle formed on Wednesday. The pattern formation on the daily chart indicates hesitancy and indecisiveness after a strong rally of 11% from the June 4, 2024, lows. However, there was no hesitancy seen in the broader markets, with Nifty Midcap and Smallcap outperforming the frontline gauge.
Overall, the sentiment remains bullish as the index trades above its 20 EMA and 50 EMA, both trending higher and in the desired sequence. Talking about the support levels, Wednesday’s low of 23,412 is likely to act as immediate support followed by the level of 23,330. On the upside, the level of 23,630-23,680 is likely to act as a resistance. It is important for the bulls to cross this hurdle for continued momentum or expect a range-bound move between 23,300 and 23,700 in the near term.
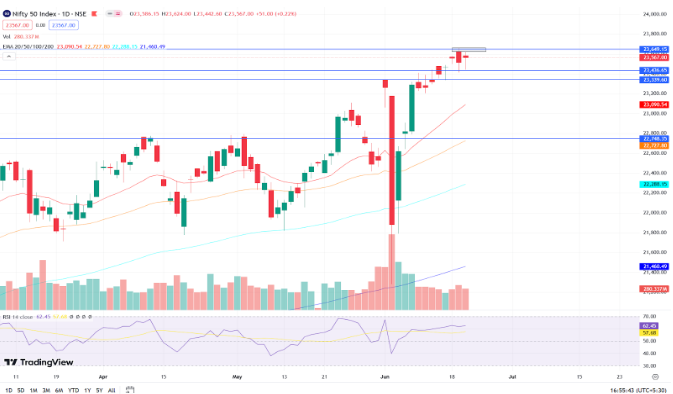
The daily 14-period RSI is above the level of 60 but has flattened, indicating that the momentum has tapered. Moreover, there is an observation of negative divergence on the RSI. Negative divergence on the Relative Strength Index (RSI) means that while the price of an index is continuing to move higher or remains at a high level, the RSI indicator is starting to make a lower high. This divergence between the price action and the RSI suggests that the momentum driving the price increase is weakening. It can be a warning signal that the current uptrend might be losing strength and could potentially reverse, indicating a possible upcoming price decline.
Conclusion and Trading Strategy
In conclusion, the bias remains positive for the index. However, waning momentum is a cause for concern. Hence, avoid aggressive trading in the index but continue to focus on stock-specific action.
Disclaimer: This blog has been written exclusively for educational purposes. The securities mentioned are only examples and not recommendations. It is based on several secondary sources on the internet and is subject to changes. Please consult an expert before making related decisions.
Published on: Jun 20, 2024, 5:43 PM IST
We're Live on WhatsApp! Join our channel for market insights & updates

Get the link to download the App

