
The NSE benchmark Nifty 50 index opened the session on a high note and swiftly climbed to a fresh all-time high of 23,411.90, surpassing its previous high reached on June 3, 2024, amid optimism from exit polls.
Despite the initial burst of enthusiasm, profit booking soon became the order of the day. Market participants opted to take profits off the table following a spectacular short-term rally. As a result, the index traded mostly sideways, except for the last 75 minutes of the session, during which it marked an intraday low.
Ultimately, the Nifty 50 index settled down by 31 points or 0.13%, closing at 23,259. The broader markets outperformed, with the Nifty Midcap 100 and Smallcap 100 ending higher by 0.08% and 1.51%, respectively. Market breadth remained strong, with advancing stocks outnumbering declining ones.
On the daily chart, the Nifty 50 index formed a pattern resembling a shooting star, though not a textbook example. This pattern, characterized by an upper shadow and a small body, suggests a potential trend reversal after an uptrend. The shooting star candlestick typically opens with buying pressure but closes near or below the opening price, indicating selling pressure at higher levels, visible in the form of the upper shadow.
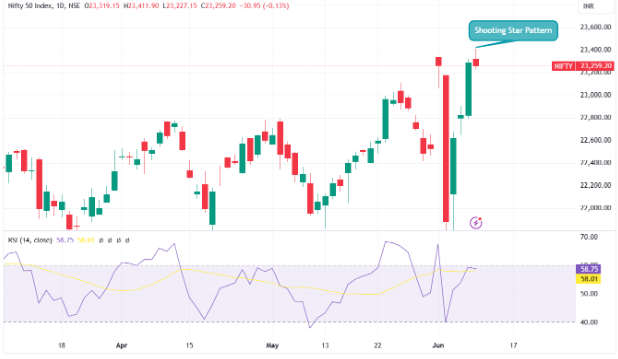
The 14-period daily RSI failed to cross above the 60-mark, which is not a favorable sign. Looking ahead, immediate support for the index is placed at 23,155, followed by 23,000. On the upside, the levels of 23,330-23,420 are likely to act as a resistance zone.
Overall, the formation of a small body negative candle with an upper shadow on the daily chart indicates market tiredness after a sharp rise. Technically, this suggests the possibility of a short-term downward correction in the market.
Disclaimer: This post has been written exclusively for educational purposes. The securities mentioned are only examples and not recommendations. It is based on several secondary sources on the internet and is subject to changes. Please consult an expert before making related decisions.
Published on: Jun 10, 2024, 5:58 PM IST
We're Live on WhatsApp! Join our channel for market insights & updates

Get the link to download the App

