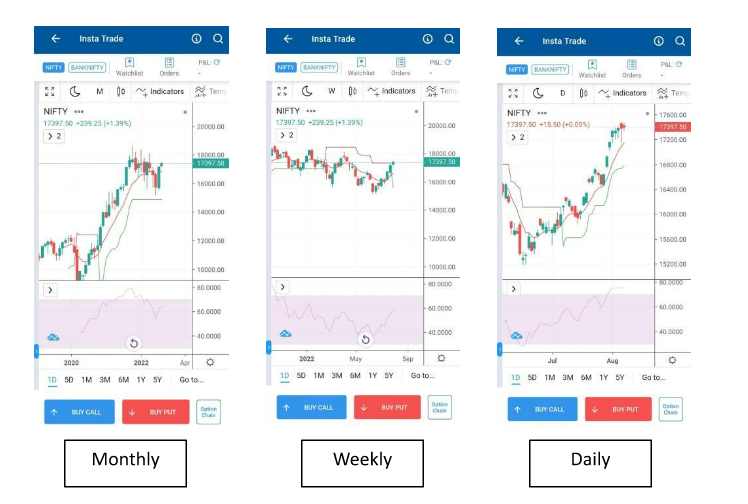

Let’s start this expiry outlook with analysis of : Monthly, Weekly, Daily time-frames.
Chart Analysis
Nifty CMP : 17397
| Time Frame | Trend | CandleStick | RSI | Resistance | Support |
| Monthly | Bullish | Neutral | 63 (Neutral to Overbought) | 18000 | 16000 |
| Weekly | Bullish | Bullish | 58 (Neutral) | R1 -18000
R2 -18300 |
S1 – 16600
S2 – 16000 |
| Daily | Bullish | Neutral | 76 (Overbought) | R1 -17500
R2 -17750 |
S1 – 17150
S2 – 17000 |
Verdict :
Chart analysis indicates Nifty is in Bullish trend. Weekly timeframe too turned positive from negative super-trend level which indicates Bullish view.
Outlook is Bullish, based on the strength of daily candles and positive cues from global markets & events.
But on a cautionary note, RSI on Daily time-frame indicates that market is in overbought zone. But as RSI in Weekly timeframe is near neutral which gives it more scope to trend in upward direction.
However, in coming trading sessions Nifty may consolidate, and Daily RSI level cools-off from 76 to 60 levels as market may not stretch much from these RSI levels at daily time-frame..
17500-17600 zone will act as major resistance zone in coming days. And 17150 & 17000 will support market.
Trades :
Charts references :

Try Insta Trade
The easiest Options trading platform! Get Charts, Watchlist, Positions & live P&L in single screen
Published on: Aug 5, 2022, 4:43 PM IST
We're Live on WhatsApp! Join our channel for market insights & updates
