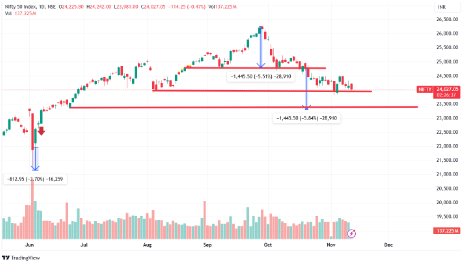
The Nifty50 index slipping below the critical 24,000 level has sent ripples across the market, prompting analysts and traders to brace for potential shifts in sentiment and volatility. With current trading levels hovering near 24,027.05 and a 114-point drop, the technical and fundamental indicators suggest critical points to watch as the index approaches sensitive levels. Here’s a closer look at the support, resistance, and overall market outlook.
A closer analysis of the daily chart reveals that the Nifty50 recently breached the neckline of a classic Head and Shoulders pattern. The technical target for this formation stands around 23,500, making it a key level of support. Adding strength to this zone, the 23,500-23,600 range aligns with multiple technical supports, including a horizontal trendline and the crucial 200-day moving average (DMA). Should the index test these levels, investors will closely monitor them.

On the upside, the index faces strong resistance within the 24,500-24,800 range. To regain a positive directional bias, Nifty50 would need to break and close above this zone, thereby forming a higher high on the charts. The 20-week moving average, positioned at 24,776, adds another layer of short- to medium-term resistance. Any movement above these levels could signal a potential shift in momentum, but until then, the index remains under pressure.
Several key technical indicators further confirm the current bearish momentum:
The technical indicators are not alone in painting a cautious picture. On the fundamental front, the earnings cycle appears to have peaked, with many companies unable to meet earnings expectations. Around 66% of Nifty 200 companies have downgraded their earnings projections, reflecting broader economic challenges.
Disclaimer: This blog has been written exclusively for educational purposes. The securities mentioned are only examples and not recommendations. It is based on several secondary sources on the internet and is subject to changes. Please consult an expert before making related decisions.
Published on: Nov 12, 2024, 2:34 PM IST
We're Live on WhatsApp! Join our channel for market insights & updates
