
A rounding bottom is a chart pattern in which the price of security forms a “U” shape, indicating a potential reversal in the trend. This pattern is often seen as a sign that the stock is oversold and that a bullish move is likely. Rounding bottoms can be formed over a period of weeks or months, and they can be accompanied by increasing trading volume.
Following are the 3 stocks which are witnessing a rounding bottom chart pattern:
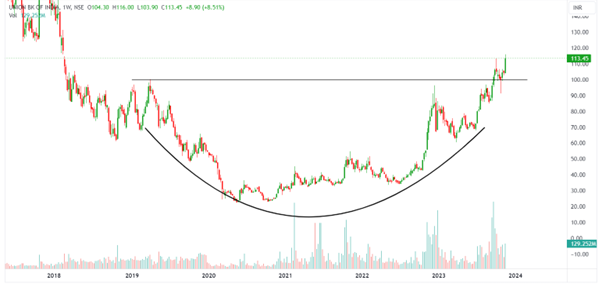
The Union Bank of India’s chart clearly exhibits a rounding bottom chart pattern, indicating a potential upward trend in the coming weeks. Currently trading at Rs 113.45, the stock has experienced a breakout from the rounding bottom pattern, signalling a potential rally. The increasing volume since the bottom formation in 2020, with spikes on higher highs, further supports this bullish outlook. Based on the rounding bottom chart pattern, the stock price could potentially reach levels around Rs 180.
The breakout of the pattern has already occurred, and the price has tested the breakout level, solidified the pattern’s validity and confirmed the bulls’ readiness to take control of the price.
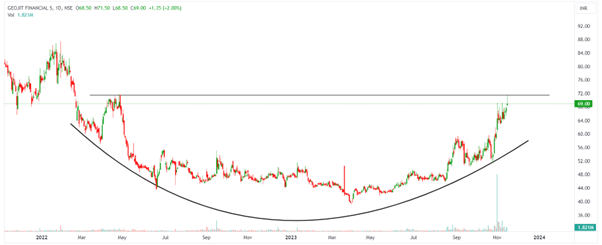
The daily timeframe chart of Geojit Financial suggests a rounding bottom chart pattern that is nearing a breakout. The stock price has been on an upward trend since finding a bottom in April, and the breakout point is approaching as volumes surge. The stock is currently trading at Rs 69, its 52-week high. Once the breakout is confirmed, the potential level could reach Rs 95. However, traders and investors should wait for confirmation before making any decisions.
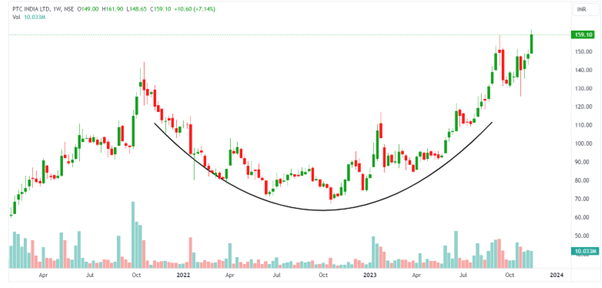
The weekly timeframe chart of PTC India suggests a rounding bottom chart pattern formation. The stock has already caught an uptrend after forming the chart pattern. The stock is trading at Rs 159.10, and the potential target price may be around Rs 210. The volumes are rising after the formation of the bottom, suggesting that bulls are showing interest in this stock, and the major uptrend is intact.
Disclaimer: This blog has been written exclusively for educational purposes. The securities mentioned are only examples and not recommendations. It is based on several secondary sources on the internet and is subject to changes. Please consult an expert before making related decisions.
Published on: Nov 15, 2023, 11:48 AM IST
We're Live on WhatsApp! Join our channel for market insights & updates

Get the link to download the App

